Abstract
Object
To test the hypotheses that intraarterial (IA) infusion allows for targeted natural killer (NK) lymphocyte delivery to hepatocellular carcinoma (HCC) and that iron oxide labeling allows for quantitative visualization of IA NK delivery with magnetic resonance imaging (MRI).
Materials and Methods
Experiments received institutional animal care and use committee approval. NK-92MI cells were labeled with superparamagnetic iron oxide (SPIO) nanoparticles. Cell viability, labeling efficacy, and cell phantom imaging studies were performed. Six rats were each implanted with two HCC tumors. Catheter was placed in proper hepatic artery for NK infusion. MRI T2* measurements for tumor and normal liver were compared pre and post infusion and correlated with histological measurements; Prussian blue staining was used for labeled NK identification. Spearman correlation coefficients and t-tests were calculated for statistical analyses.
Results
Increasing SPIO incubation concentration decreased cell viability. Labeling efficacy was 88.0±3.1% (mean±SD) across samples. The spatial extent of T2*-weighted contrast and R2* relaxivity values increased for cell phantom samples incubated with increasing SPIO concentrations. T2* measurements decreased in the tumor and normal liver tissues after NK infusion (p<0.001); ΔT2* was greater in tumors than in normal liver tissue (p<0.001). Histological measurements demonstrated increased NK delivery to the tumor compared to the normal liver (p<0.001). ΔT2* was well-correlated with histological NK measurements (ρ=0.70).
Conclusion
IA infusion permitted selective delivery of NK cells to HCC. Transcatheter delivery of SPIO-labeled NK cells can be quantitatively visualized with MRI.
Keywords: natural killer lymphocyte, superparamagnetic iron oxide nanoparticles, transcatheter intraarterial delivery, hepatocellular carcinoma, magnetic resonance imaging
Introduction
Liver-directed therapies such as transcatheter arterial chemoembolization and radioembolization are widely used for the palliative treatment of hepatocellular carcinoma (HCC) (1-3). The tumor-specific selectivity afforded via intraarterial (IA) delivery is due to an increase in the tumor blood supply derived from the hepatic artery as the tumor progresses (4).
Adoptive immunotherapy (AIT) with natural killer (NK) lymphocytes is a promising approach for the treatment of solid tumors. The cytotoxicity of NK cells plays an important role in the destruction of cancer cells. Reduced NK cell activity is associated with increased tumor occurrence and metastasis (5, 6). NK cells destroy cancer cells by secreting cytotoxic tumor-killing lymphokines and disrupting the tumor vasculature (7-9).
Quantification of the NK dose delivered to tumors may be critical to optimize procedures or predict response. Radiolabeling has been used to track the migration of NK cells to liver metastases in patients with colon carcinoma; however, while highly sensitive for the detection of radiolabeled cells, nuclear imaging methods provide relatively poor soft tissue contrast for depiction of background tissues and poor spatial resolution compared to computed tomography and magnetic resonance imaging (MRI) (10).
Exogenous labeling with iron oxide agents permits serial in vivo MRI of cell migration and determination of resulting biodistribution (11). Superparamagnetic iron oxide (SPIO) nanoparticles are sequestered within cells, inducing field inhomogeneities due to magnetic susceptibility differences between labeled cells and background tissues (12). These field perturbations lead to signal reductions within T2*-weighted MR images thus permitting in vivo visualization of SPIO-labeled cell delivery and migration.
Recent studies demonstrated that SPIO labeling can visualize NK cell migration following IV administration. Intratumoral accumulation of SPIO-labeled NK cells targeting EpCAM-positive prostate tumors in a rat model produced significant reductions in tumor signal intensity within T2*-weighted images. Similar approaches permitted in vivo visualization of intratumoral accumulation following IV infusion of SPIO-labeled NK cells targeting HER2/neu receptors in a mouse model of breast cancer (13).
Intraprocedural imaging is playing an increasingly important role in interventional oncology. IA delivery of therapeutic materials (drugs, embolic particles, or microspheres) can be immediately confirmed, thus prompting rapid adjustments to infusion catheter placement or allowing for the timely adoption of alternative treatment strategies as necessary (14). NK lymphocyte AIT should similarly benefit from image-guided transcatheter IA infusion approaches to selectively target liver tumors while providing feedback for confirmation of successful delivery.
The purpose of this study was to test the hypotheses that: a) transcatheter IA infusion targets the delivery of NK lymphocytes to HCC and b) SPIO labeling permits MRI visualization and quantification of NK delivery to HCC immediately following these interventional procedures.
Materials and Methods
Experimental Overview
NK lymphocytes were labeled with SPIO nanoparticles. Cell phantoms were used to evaluate the relationship between T2* and cell concentrations. In a xenograft HCC model, labeled NKs were infused into the proper hepatic artery (PHA); T2* measurements in tumor and normal liver tissues were compared before and after NK infusion. Histological measurements of NK cell delivery to the tumor and normal liver were compared. MRI measurements were compared to corresponding histological measurements of NK delivery.
Cell Labeling
NK-92MI (ATCC, Manassas, VA) lymphocytes were cultured in supplemented alpha minimum essential medium (MEM) (Cellgro, Manassas, VA) (15). Samples of 4.0×10⁶ NK lymphocytes were incubated with 10, 20, 30, 50, and 100 pg iron/cell suspensions of FeOlabel – Texas Red (GENOVIS AB, Sweden) nanoparticles and 4.5 μg/mL of protamine sulfate for viability, labeling efficacy, and MRI studies. Control group cells underwent the same protocol without SPIOs. NKs were incubated with 10 and 100 pg iron/cell suspensions for transmission electron microscope (TEM) studies, and a final set of NKs was incubated with 30 pg iron/cell suspensions for transcatheter infusion.
NK cells were subcultured in 5 mL of medium prior to addition of SPIOs; final SPIO labeling concentrations were 8, 16, 24, 40, and 80 μg iron/mL of medium (corresponding to 10, 20, 30, 50, and 100 pg iron/cell). Unincorporated SPIOs were removed by washing with alpha MEM. Before and after incubation with SPIO suspensions, cell viabilities were assessed by trypan blue.
Labeling efficiency was determined using fluorescence microscopy. Those NK samples not intended for transcatheter infusion were fixed in formalin for 30 minutes at room temperature. Supernatant was then collected for fluorescence microscopy (pellet contents were utilized for MR phantom studies); 10 μL cell suspensions were placed upon microscope slides and evaporated. Samples were covered with hardset mounting medium with DAPI nucleic acid counterstain (Vector Laboratories, Inc., Burlingame, CA) and coverslipped. Cells were considered labeled if intracytoplasmic red fluorescence could be detected. Slides were observed with a Zeiss LSM 510 META confocal microscope with 405 nm laser (Carl Zeiss Microscopy, LLC, Thornwood, NY) and 40× oil immersion lens. Percentages of labeled NKs were determined in 10 fields on each slide for each group.
TEM was used to verify intracellular SPIO uptake in the 10 and 100 pg/cell incubation groups; images were obtained using a FEI Tecnai Spirit G2 operating at 120 kV (FEI Company, Hillsboro, OR).
MRI of Labeled NK Cell Phantoms
Formalin-fixed cells were transferred to 1.5 mL tubes for MR phantom studies. The first set of labeled cells and an unlabeled control were used for qualitative pelleted cell phantom imaging studies. Six samples of 4.0×10⁶ NK cells were pelleted at 1250 RPM for 5 minutes and covered with 0.5 mL of 2.0% agarose before an additional 1250 RPM centrifugation for 5 minutes. The second set of labeled cells was diluted to give concentrations of 4.0×10⁶, 2.0×10⁶, 1.0×10⁶, 0.5×10⁶, and 0.5×10⁵ cells/mL; these were uniformly suspended by vortexing in 0.5 mL of 2.0% agarose for quantitative MRI relaxivity studies. An unlabeled cell suspension served as a control.
MRI was performed using a 7.0T 30 cm bore Bruker ClinScan MRI (Bruker BioSpin, Billerica, MA) with 75 mm QuadTransceiver rat coil (Bruker BioSpin, Billerica, MA) (Table 1).
Table 1.
MRI Parameters
| Sequence type |
Gradient Echo (GRE): Qualitative MRI |
Gradient Echo (GRE): T2* map |
Turbo Spin Echo (TSE): Anatomical Image |
Gradient Echo (GRE): T2* map |
|---|---|---|---|---|
|
Repetition
time (TR)/echo time (TE) (msec) |
50/10.00 | 1100/(6.00, 9.09, 12.18, 15.27, 18.36, 21.45, 63.09, 66.18, 69.27, 72.36) |
841/28.00 | 598/(2.91, 6.63, 10.35, 14.07) |
|
Flip angle
(°) |
9 | 30 | 180 | 30 |
|
Field of
view (FOV) (mm2) |
45×37 | 57×57 | 70×70 | 60×49 |
| Matrix | 128×128 | 128×128 | 128×128 | 192×192 |
|
Imaging
bandwidth (BW) (Hz/pixel) |
300 | 500 | 200 | 500 |
|
Slice
thickness (mm) |
0.30 | 1.5 | 1.0 | 1.0 |
|
Voxel size
(mm3) |
0.35×0.35×0.30 | 0.45×0.45×1.50 | 0.55×0.55×1.00 | 0.31×0.31×1.00 |
T2* signal decay curves were generated by drawing regions of interest (ROI) within cell phantom images acquired at each echo time (TE) and recording the mean signal within these ROIs using ImageJ (National Institutes of Health). T2* decay constants were then determined from signal decay curves using the monofit function in Excel (Microsoft Corporation, Redmond, WA). For each SPIO incubation concentration, relaxivities were determined from the slope of plots of R2* versus concentrations of labeled cells.
Animal Model
All studies were approved by our institutional animal care and use committee. Six male Sprague Dawley rats (Charles River, Wilmington, MA) weighing 350 to 400 g were used for these studies. Rats were anesthetized with 2% isoflurane. After laparotomy, 2.0×10⁶ McA-RH7777 HCC cells were injected under the hepatic capsule in left lateral and median liver lobes (16). Abdominal incisions were then closed, and tumors grew for eight days before imaging.
MRI of Transcatheter NK Cell Delivery
MRI was performed to confirm tumor growth prior to catheter placement and NK infusion (using 7.0T Clinscan with small animal gating system (Small Animal Instruments, Inc., Stony Brook, NY)). Tumor size was determined (Table 1) and measured using the syngo fastView (Siemens AG, Germany) image analysis software package; the longest in-plane diameter (per RECIST guidelines) and the width perpendicular to the longest diameter were used to estimate overall tumor growth (17). T2* maps (Table 1) were generated pre and post NK infusion. Mean T2* values in the tumor and in the normal liver were measured before and after labeled NK infusion. ROIs were drawn in MATLAB 7.12 (MathWorks, Natick, MA) to measure T2* values in the viable tumor (excluding the hypointense necrotic core) and in the normal liver.
The following procedures were used to invasively catheterize the proper hepatic artery (PHA) for NK cell infusion; catheterizations and infusions were performed in a surgical area within the MRI facility. First, after laparotomy, a cotton-tipped applicator was used to expose the common hepatic artery (CHA), PHA, and gastroduodenal artery (GDA). A micro bulldog clamp placed on the CHA prevented bleeding during catheterization. 4-0 polyglycolic acid suture was used to ligate the GDA distally in order to control retrograde bleeding during catheterization. A 24G polyurethane catheter (Terumo Medical Co., Somerset, NJ) was inserted into the GDA and advanced into the PHA. 0.1 mL of heparin lock flush was injected followed by DSA with a PowerMobile C-ARM angiographic system (Siemens AG, Germany) to confirm catheter placement in the PHA. 4.0×10⁶ labeled NK lymphocytes incubated in 30 pg iron/cell suspended in 0.5 mL of alpha MEM were infused into the PHA followed by 0.2 mL of saline flush. Blood flow to the liver was restored by releasing the micro bulldog clamp after catheter removal and proximal ligation of the GDA; post infusion T2* mapping was performed after closure of the abdominal cavity.
Histologic Evaluation of Transcatheter NK Cell Delivery
Immediately after completion of NK infusion and MRI, rats were euthanized. Livers were harvested and fixed in formalin; sections of tumor and normal liver tissue were embedded in paraffin for Prussian blue staining (18). These slides were examined at 20× with light microscopy; additionally, 40× fluorescence microscopy was used to visualize corresponding tissue sections counterstained with DAPI nucleic acid.
Percentages of total area of high-powered (20×) fields stained by Prussian blue (%HPF) were determined by color thresholding in ImageJ. Five representative views were sampled for regions of viable tumor and for regions of normal liver.
Statistical Analysis
Statistical analyses were performed with MATLAB 7.12. Data are presented as mean±standard error of the mean (SEM) or mean±standard deviation (SD) as indicated. Significance was achieved at p values less than 0.05. Comparisons of cell viability changes and labeling efficacy across all SPIO concentration groups were made using a single factor ANOVA test. Least squares curve fitting was used for decay curve analysis to determine T2* time constants; separately for the series of NK samples produced at each of the 5 incubation concentrations, linear regression was used to estimate corresponding relaxivity (sec−1/(cells/mL)) values. T2* measurements in tumors and in normal liver tissues were compared pre and post infusion by paired t-test. Unpaired t-tests were used to compare the decrease in T2* after NK infusion between the tumor and normal liver and the histological NK %HPF between the tumor and normal liver. Spearman correlation coefficient was used to evaluate the relationship between ΔT2* and histological labeled NK %HPF measurements.
Results
Cell Labeling
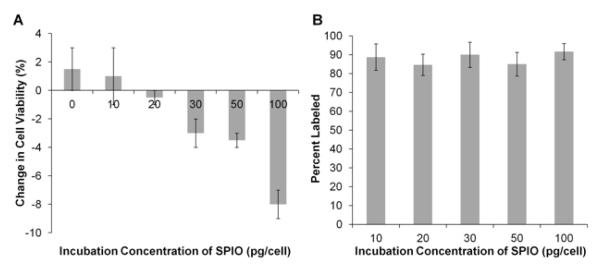
Cell viabilities for all groups were >90% before labeling (93.6±0.9%, mean±SD). After incubation with 0, 10, 20, 30, 50, and 100 pg/cell suspensions of the SPIO probe, absolute percentage changes in cell viabilities were +1.5±1.5, +1.0±2.0, −0.5±0.5, −3.0±1.0, −3.5±0.5, and −8.0±1.0% (mean±SEM), respectively (Fig 1A); absolute decreases in cell viability for the 100 pg/cell group were significantly greater than for all other groups (p<0.05).
Figure 1.
Cell labeling studies. A. Absolute percentage change in cell viability after incubation with superparamagnetic iron oxide (SPIO) nanoparticles. Cell viabilities prior to labeling were greater than 90% for all samples. Cell viability increased for 0 and 10 pg/cell SPIO suspensions and decreased for SPIO suspensions of 20 pg/cell and greater. B. Labeling efficacy with SPIOs. All incubation concentrations labeled on average 88.0% of the natural killer (NK) cells. Error bars indicate standard error of the mean.
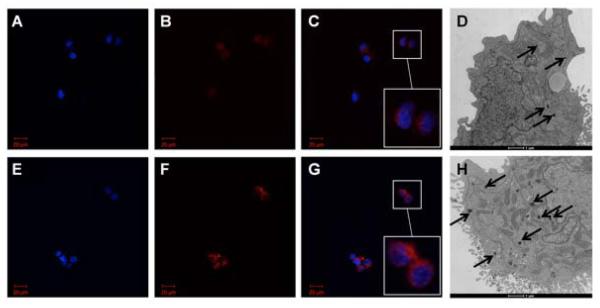
Incubation with 10, 20, 30, 50, and 100 pg/cell of the SPIO agent did not result in significantly different labeling efficiencies (p=0.90); the percentage of labeled cells was 88.0±3.1% (mean±SD) across samples (Fig 1B). However, the 100 pg/cell samples consistently demonstrated increased intensity and spatial extent of red fluorescence compared to 10 pg/cell incubation samples (Fig 2 A – C, E – G).
Figure 2.
Representative microscopy. Fluorescence microscopy of labeled natural killer (NK) cells. 40× oil immersion view. A – C. 10 pg/cell superparamagnetic iron oxide (SPIO) nanoparticles. E – G. 100 pg/cell SPIO nanoparticles. Blue DAPI-stained nuclei (A, E) surrounded by Texas Red particles in cytoplasm (B, F); merged images (C, G) with digital zoom inset. Note increased red fluorescence in 100 pg/cell sample compared to 10 pg/cell sample. Transmission electron microscopy (TEM) of labeled NK cells. D. 10 pg/cell SPIOs. H. 100 pg/cell SPIOs. Internalized SPIOs indicated by black arrows. Note increased size and number of groups of internalized SPIOs in 100 pg/cell sample compared to 10 pg/cell sample.
TEM of labeled NK cells demonstrated an increase in the size and number of internalized groups of SPIOs in the 100 pg/cell versus 10 pg/cell incubation groups (Fig 2D and 2H). SPIOs were visible as dark features; the vast majority of SPIOs appeared to be clustered within intracellular compartments.
MRI of Labeled NK Cell Phantoms
Pelleted samples of 4.0×10⁶ NKs incubated in 0, 10, 20, 30, 50, and 100 pg/cell were covered in 2.0% agarose for qualitative MRI studies. Within T2*-weighted images, the spatial extent of the resulting signal voids increased in proportion to the SPIO incubation concentrations from 0 to 100 pg/cell (Fig 3).
Figure 3.

Pelleted cell phantoms for qualitative MRI (GRE sequence: TR=50 msec; TE=10.00 msec; flip angle=9°). Phantom studies demonstrated that the spatial extent of T2*-weighted image contrast (the region of signal reduction due to magnetic susceptibility) increased with increasing superparamagnetic iron oxide (SPIO) nanoparticle incubation concentrations from 0 to 100 pg/cell. All samples contained 4.0×10⁶ natural killer (NK) cells.
For quantitative MRI studies, estimation of R2* relaxivities by least squares curve fitting yielded R2 values ranging from 0.738 to 0.923. Plots of R2* relaxivity values against SPIO incubation concentration demonstrated monotonically increasing relationships between relaxivity and incubation concentration (Fig 4). T2* decreases compared to the unlabeled NK control were on the order of 101 msec for the labeled NK concentrations utilized in the cell phantom study.
Figure 4.
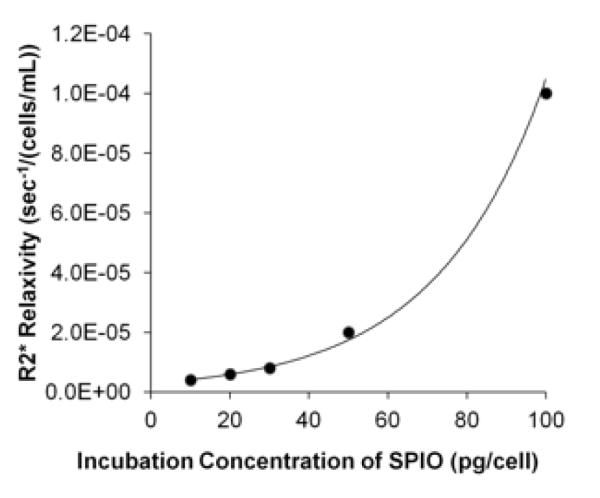
Relaxivity values for natural killer (NK) cells incubated with different superparamagnetic iron oxide (SPIO) concentrations. R2* relaxivity versus SPIO incubation concentration; note the monotonically increasing relationship between R2* relaxivity and SPIO incubation concentration.
MRI of Transcatheter NK Cell Delivery
Tumor growth was confirmed at both inoculation sites for each of the six rats (N=12 total tumors). In T2-weighted images, these tumors were hyperintense compared to normal liver tissues (Fig 5A). Tumor sizes were 7.1±1.9 mm by 5.4±1.3 mm in left lateral lobe and 6.4±1.3 mm by 5.4±0.7 mm in median lobe (longest in-plane tumor diameter and tumor dimension perpendicular to this diameter, respectively).
Figure 5.
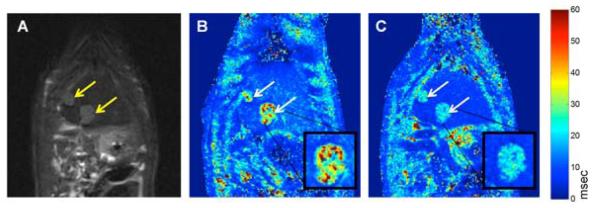
Representative MR images, coronal sections. Arrows indicate tumor growth sites. A. T2-weighted TSE anatomical image (TSE sequence: TR=841 msec; TE=28.00 msec; flip angle=180°). B. Pre-SPIO-labeled NK infusion T2* map. C. Post-SPIO-labeled NK infusion T2* map. T2* maps acquired with a GRE sequence (TR=600 msec; TE=2.9, 6.6, 10.4, 14.0 msec; flip angle=30°). Digital zoom inset of representative tumor. Note the apparent decrease in T2* values within tumors and normal liver tissues after NK infusion.
Identification of the PHA and its subsequent catheterization was successful in 100% (6/6) of the rats, confirmed on DSA (Fig 6).
Figure 6.
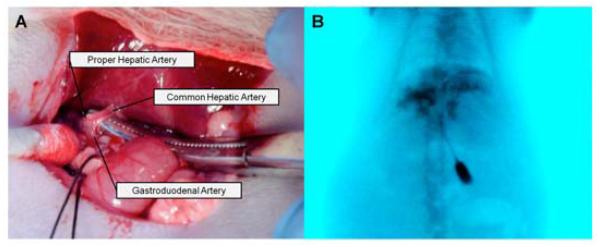
Proper hepatic artery (PHA) catheterization. A. Identification of the PHA, common hepatic artery (CHA), and gastroduodenal artery (GDA). Initial catheter entry was through the GDA, after which it was advanced into the PHA. B. DSA depicting contrast (iohexol) injected through the PHA into the liver.
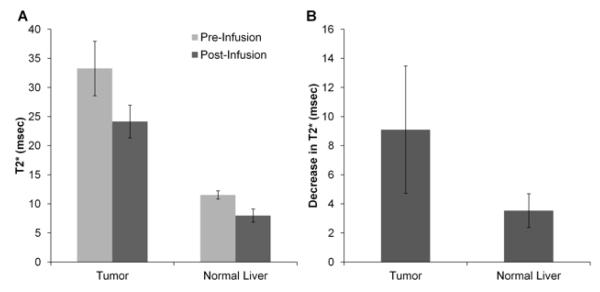
T2* maps generated from intraprocedural MRI scans demonstrated decreases in tumor and liver T2* values following NK infusion (Fig 5B and C). T2* values decreased for both tumor tissues (pre 18.1±5.0 msec, post 13.6±4.8 msec, p<0.001) and normal liver tissues (pre 11.5±0.7 msec, post 8.0±1.1 msec, p<0.001) (Fig 7A); however, T2* decreases were larger in tumors (9.1±4.4 msec) than in normal liver tissues (3.5±1.2 msec) (p<0.001) (Fig 7B).
Figure 7.
T2* measurements. A. Bar graph depicting T2* values in tumor and liver tissues before and after SPIO-labeled NK cell infusion. T2* changes were greater in the tumor compared to in the normal liver. B. Bar graph depicting decreases in T2* values after SPIO-labeled NK cell infusion in tumor and normal liver tissues. The T2* decrease was greater in tumor than in normal liver tissues (p<0.05).
Histologic Evaluation of Transcatheter NK Cell Delivery
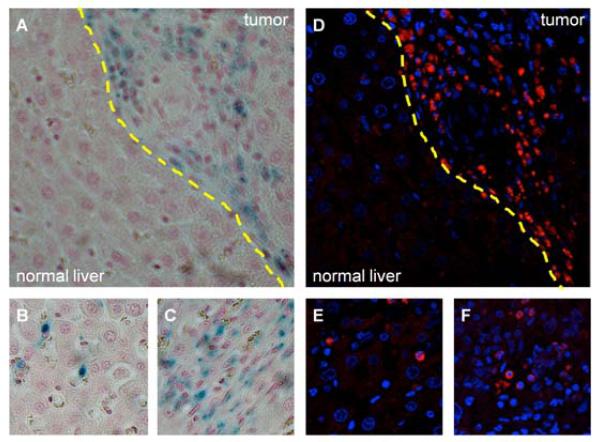
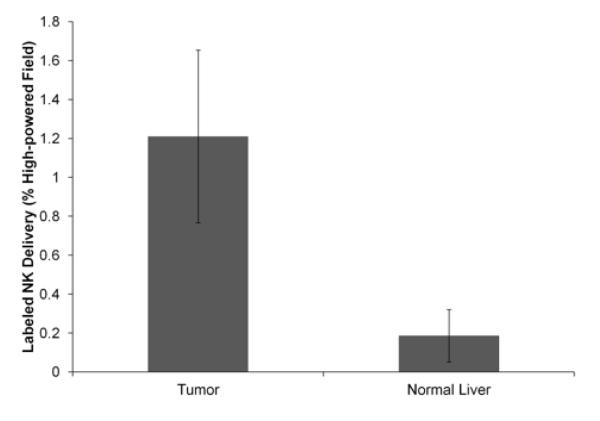
The spatial distribution of Prussian blue staining within microscopy slides was well-correlated to the corresponding distribution of Texas Red fluorescence observed during fluorescence microscopy (Fig 8). Qualitatively, increased amounts of both Prussian blue staining and Texas Red fluorescence were seen in the tumor compared to in the adjacent normal liver tissue. NK cell delivery was quantified histologically on light microscopy as the percentage of the total area of each high-powered (20×) field stained by Prussian blue. Histologic %HPF measurements demonstrated significantly increased NK delivery to the tumor (1.21±0.44%) in comparison to the surrounding normal liver tissues (0.19±0.13%) (p<0.001) (Fig 9).
Figure 8.
Microscopy. A – C. 20× original magnification light microscopy. Prussian blue iron stain demonstrates labeled NK cells primarily in the tumor (A, tumor and normal liver separated by dashed yellow line); digital zoom panels illustrate the presence of labeled NKs in both the normal liver (B) and tumor (C). D – F. 40× original magnification fluorescence microscopy. NK cells (blue nuclei surrounded by Texas Red nanoparticles) infiltrating primarily tumor tissue (D, tumor and normal liver separated by dashed yellow line); digital zoom panels illustrate the presence of labeled NKs in both the normal liver (E) and tumor (F). Light microscopy and fluorescence views are of corresponding sections; note the similar distribution of SPIO-labeled NK lymphocytes between A and D.
Figure 9.
Bar graph depicting histological SPIO-labeled NK cell delivery for the tumor and normal liver. NK cell delivery was greater in the tumor than in the normal liver.
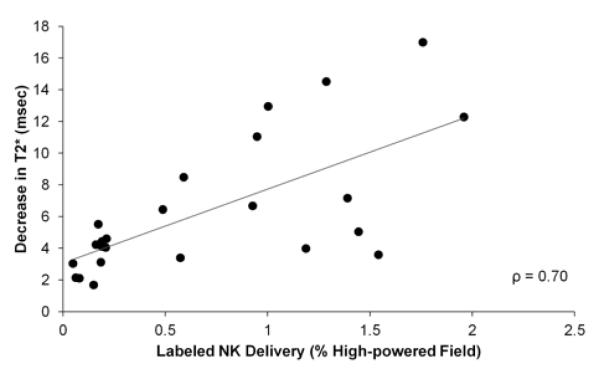
Post infusion decreases in tumor and normal liver tissue T2* measurements were well-correlated with the histological NK measurements (ρ=0.70, p<0.001) (Fig 10).
Figure 10.
Scatterplot depicts relationship between the decrease in T2* measurements and histological measurements of SPIO-labeled NK cell delivery; MR measurements were well-correlated with histological measurements of NK cell distribution in the tissue sections.
Discussion
Transcatheter IA therapies selectively target HCC due to the preferential arterial blood supply of hepatic tumors (19). AIT with NK lymphocytes is a promising approach for the treatment of HCC; however, similar to chemotherapy and brachytherapy, IV administration routes may limit the dose that ultimately reaches the targeted tumor(s). The current study demonstrated that a) transcatheter IA delivery of NK lymphocytes permits selective delivery to HCC with significantly increased NK doses delivered to the tumor tissues compared to adjacent normal tissues and that b) SPIO labeling of NKs permits intraprocedural visualization of targeted intrahepatic delivery detected as significant reductions in tumor T2* immediately post infusion.
NK-92MI cells were incubated with SPIO nanoparticles for labeling. We tested several incubation concentrations within the dose range specified by the manufacturer; 30 pg/cell was determined to provide a sufficient amount of MR contrast during qualitative visualization and quantitative R2* relaxivity phantom studies. We observed a monotonic decrease in cell viability as cells were incubated in increasing amounts of SPIOs; the significantly greater drop in cell viability for the 100 pg/cell incubation group suggested that this incubation concentration may be inappropriate for in vivo studies. Sufficient image contrast was achieved at 30 pg/cell without significantly compromising cell viability. At this concentration, viabilities decreased by only 3.0% after labeling (compared to controls); 90.5% of the NKs remained viable. Maintenance of a large proportion of viable cells is desirable for future studies of AIT response requiring viable NK cells for cytotoxic activity. Cell viability is also of great importance for quantitative imaging; SPIO label released from nonviable, lysed cells could confound T2*-based estimates of NK delivery.
Histologic evaluation consisted of quantitative analysis of labeled NK distribution by Prussian blue staining and qualitative visualization of labeled NK distribution by fluorescence microscopy. Prussian blue staining demonstrated increased NK delivery to the tumor in comparison to the normal liver (p<0.001), consistent with the selective IA delivery to the tumor observed with quantitative MRI. Fluorescence and light microscopy of corresponding tissue sections revealed a consistent distribution of Texas Red fluorescence and Prussian blue iron stain – both methods demonstrated increased labeled NK delivery to the tumor compared to the normal liver. This observation is consistent with prior interventional oncology studies demonstrating selective delivery of therapeutic agents (lipiodol, DC Bead microspheres, and yttrium-90 microspheres) to HCC via hepatic arterial administration routes and thus strongly supports the utilization of transcatheter IA infusion approaches for delivery of NK lymphocytes during AIT for HCC (20).
T2* measurements significantly decreased in both the tumor and normal liver tissues after labeled NK infusion (p<0.001). The absolute decrease in T2* was significantly greater in tumor tissues compared to normal liver tissues (p<0.001). The absolute decrease in T2* measurements observed in vivo was 9.1±4.4 msec for the tumor and 3.5±1.2 msec for the normal liver. Absolute T2* decreases were on the order of 101 msec in the quantitative cell phantom study that spanned 0.5×10⁵ to 4.0×10⁶ labeled cells/mL. Given that 4.0×10⁶ labeled cells were infused into livers with tumors each measuring roughly 0.5 cm by 0.5 cm, the cell phantom data and in vivo data appear to be consistent, yielding similar ΔT2* measurements. While additional studies may be required to further quantify ΔT2* changes resulting from SPIO-labeled cells, the results of the current cell phantom and in vivo data suggest the feasibility of using MRI to both visualize and estimate the intrahepatic distribution of SPIO-labeled NK lymphocytes.
Due to the difficulties associated with coregistering MR images and histologic specimens, our histologic specimens and MR ROI analyses utilized mean tumor values from these measurements (21). From this approach, we observed that the absolute decrease in T2* was well-correlated with histological NK measurements, suggesting that noninvasive MRI may serve as a surrogate measure of labeled NK cell delivery as measured by gold standard histopathology.
Our study had several limitations. The SPIO labeling agent used for our studies is not US Food and Drug Administration (FDA)-approved; however, it is similar in size and function to approved (but no longer commercially available) agents such as Feridex and Endorem. Despite the utility of fluorescence markers for histologic evaluation, optical imaging techniques are difficult to implement clinically due to poor tissue penetration by visible light and limited spatial resolution (22). Future studies will likely benefit from the use of FDA-approved agents without fluorescence to facilitate clinical translation. The NK-92MI cell line also did not pellet well during centrifugation, likely accounting for the irregular patterns of contrast in the qualitative cell phantom study. Finally, the current study does not assess the relationship between therapeutic outcomes and delivered NK dose. Future studies are planned to compare IV and IA administration routes for NK AIT.
Practical Applications
We have demonstrated that transcatheter infusion permits selective delivery of NK lymphocytes to HCC and that intrahepatic delivery of iron oxide labeled NK cells can be quantitatively visualized with MRI. MRI-based estimation of NK lymphocyte doses delivered to tumors could one day enable clinicians to optimize patient-specific therapeutic regimens during NK cell AIT for the treatment of HCC.
References
- 1.Lewandowski RJ, Kulik LM, Riaz A, et al. A Comparative Analysis of Transarterial Downstaging for Hepatocellular Carcinoma: Chemoembolization Versus Radioembolization. Am J Transplantation. 2009;9(8):1920–8. doi: 10.1111/j.1600-6143.2009.02695.x. [DOI] [PubMed] [Google Scholar]
- 2.Llovet JM, Real MI, Montaña X, et al. Arterial embolisation or chemoembolisation versus symptomatic treatment in patients with unresectable hepatocellular carcinoma: a randomised controlled trial. The Lancet. 2002;359(9319):1734–9. doi: 10.1016/S0140-6736(02)08649-X. [DOI] [PubMed] [Google Scholar]
- 3.Salem R, Lewandowski RJ, Mulcahy MF, et al. Radioembolization for Hepatocellular Carcinoma Using Yttrium-90 Microspheres: A Comprehensive Report of Long-term Outcomes. Gastroenterology. 2010;138(1):52–64. doi: 10.1053/j.gastro.2009.09.006. [DOI] [PubMed] [Google Scholar]
- 4.Cabrera R, Nelson D. Review article: the management of hepatocellular carcinoma. Aliment Pharmacol Ther. 2010;31(4):461–76. doi: 10.1111/j.1365-2036.2009.04200.x. [DOI] [PubMed] [Google Scholar]
- 5.Taketomi A, Shimada M, Shirabe K, Kajiyama K, Gion T, Sugimachi K. Natural killer cell activity in patients with hepatocellular carcinoma. Cancer. 1998;83(1):58–63. doi: 10.1002/(sici)1097-0142(19980701)83:1<58::aid-cncr8>3.0.co;2-a. [DOI] [PubMed] [Google Scholar]
- 6.Son K, Kew M, Rabson AR. Depressed natural killer cell activity in patients with hepatocellular carcinoma in vitro effects of interferon and levamisole. Cancer. 1982;50(12):2820–5. doi: 10.1002/1097-0142(19821215)50:12<2820::aid-cncr2820501222>3.0.co;2-#. [DOI] [PubMed] [Google Scholar]
- 7.Morris M, Ley K. Trafficking of natural killer cells. Curr Mol Med. 2004;4(4):431–8. doi: 10.2174/1566524043360609. [DOI] [PubMed] [Google Scholar]
- 8.Rabinowich H, Vitolo D, Altarac S, Herberman R, Whiteside T. Role of cytokines in the adoptive immunotherapy of an experimental model of human head and neck cancer by human IL-2-activated natural killer cells. J Immunol. 1992;149(1):340–9. [PubMed] [Google Scholar]
- 9.Sasaki A, Melder RJ, Whiteside TL, Herberman RB, Jain RK. Preferential Localization of Human Adherent Lymphokine-Activated Killer Cells in Tumor Microcirculation. J Natl Cancer Inst. 1991;83(6):433–7. doi: 10.1093/jnci/83.6.433. [DOI] [PubMed] [Google Scholar]
- 10.Matera L, Galetto A, Bello M, et al. In vivo migration of labeled autologous natural killer cells to liver metastases in patients with colon carcinoma. Journal of Translational Medicine. 2006;4:49. doi: 10.1186/1479-5876-4-49. [DOI] [PMC free article] [PubMed] [Google Scholar]
- 11.Daldrup-Link HE, Rudelius M, Piontek G, et al. Migration of Iron Oxide–labeled Human Hematopoietic Progenitor Cells in a Mouse Model: In Vivo Monitoring with 1.5-T MR Imaging Equipment1. Radiology. 2005;234(1):197–205. doi: 10.1148/radiol.2341031236. [DOI] [PubMed] [Google Scholar]
- 12.Fleige G, Seeberger F, Laux D, et al. In vitro characterization of two different ultrasmall iron oxide particles for magnetic resonance cell tracking. Invest Radiol. 2002;37(9):482–8. doi: 10.1097/00004424-200209000-00002. [DOI] [PubMed] [Google Scholar]
- 13.Daldrup-Link HE, Meier R, Rudelius M, et al. In vivo tracking of genetically engineered, anti-HER2/neu directed natural killer cells to HER2/neu positive mammary tumors with magnetic resonance imaging. Eur Radiol. 2005;15(1):4–13. doi: 10.1007/s00330-004-2526-7. [DOI] [PubMed] [Google Scholar]
- 14.Virmani S, Wang D, Harris K, et al. Comparison of transcatheter intraarterial perfusion MR imaging and fluorescent microsphere perfusion measurements during transcatheter arterial embolization of rabbit liver tumors. J Vasc Interv Radiol. 2007;18(10):1280–6. doi: 10.1016/j.jvir.2007.07.008. [DOI] [PubMed] [Google Scholar]
- 15.Tam YK, Maki G, Miyagawa B, Hennemann B, Tonn T, Klingemann HG. Characterization of genetically altered, interleukin 2-independent natural killer cell lines suitable for adoptive cellular immunotherapy. Hum Gene Ther. 1999;10(8):1359–73. doi: 10.1089/10430349950018030. [DOI] [PubMed] [Google Scholar]
- 16.Guo Y, Klein R, Omary RA, Yang GY, Larson AC. Highly malignant intra-hepatic metastatic hepatocellular carcinoma in rats. Am J Transl Res. 2010;3(1):114–20. [PMC free article] [PubMed] [Google Scholar]
- 17.Eisenhauer EA, Therasse P, Bogaerts J, et al. New response evaluation criteria in solid tumours: revised RECIST guideline (version 1.1) Eur J Cancer. 2009;45(2):228–47. doi: 10.1016/j.ejca.2008.10.026. [DOI] [PubMed] [Google Scholar]
- 18.Frank JA, Miller BR, Arbab AS, et al. Clinically Applicable Labeling of Mammalian and Stem Cells by Combining Superparamagnetic Iron Oxides and Transfection Agents1. Radiology. 2003;228(2):480–7. doi: 10.1148/radiol.2281020638. [DOI] [PubMed] [Google Scholar]
- 19.Breedis C, Young G. The blood supply of neoplasms in the liver. Am J Pathol. 1954;30:969–77. [PMC free article] [PubMed] [Google Scholar]
- 20.Liapi E, Geschwind J-F. Intra-Arterial Therapies for Hepatocellular Carcinoma: Where Do We Stand? Ann Surg Oncol. 2010;17(5):1234–46. doi: 10.1245/s10434-010-0977-4. [DOI] [PubMed] [Google Scholar]
- 21.Jin N, Deng J, Chadashvili T, et al. Carbogen Gas–Challenge BOLD MR Imaging in a Rat Model of Diethylnitrosamine-induced Liver Fibrosis1. Radiology. 2010;254(1):129–37. doi: 10.1148/radiol.09090410. [DOI] [PMC free article] [PubMed] [Google Scholar]
- 22.Jha P, Golovko D, Bains S, et al. Monitoring of Natural Killer Cell Immunotherapy Using Noninvasive Imaging Modalities. Cancer Res. 2010;70(15):6109–13. doi: 10.1158/0008-5472.CAN-09-3774. [DOI] [PMC free article] [PubMed] [Google Scholar]


