Figure 5.

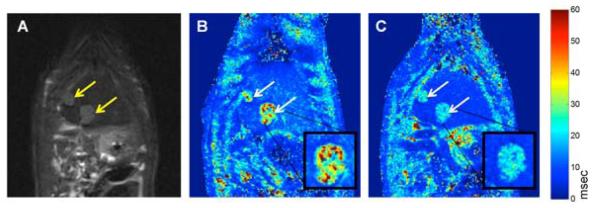
Representative MR images, coronal sections. Arrows indicate tumor growth sites. A. T2-weighted TSE anatomical image (TSE sequence: TR=841 msec; TE=28.00 msec; flip angle=180°). B. Pre-SPIO-labeled NK infusion T2* map. C. Post-SPIO-labeled NK infusion T2* map. T2* maps acquired with a GRE sequence (TR=600 msec; TE=2.9, 6.6, 10.4, 14.0 msec; flip angle=30°). Digital zoom inset of representative tumor. Note the apparent decrease in T2* values within tumors and normal liver tissues after NK infusion.
