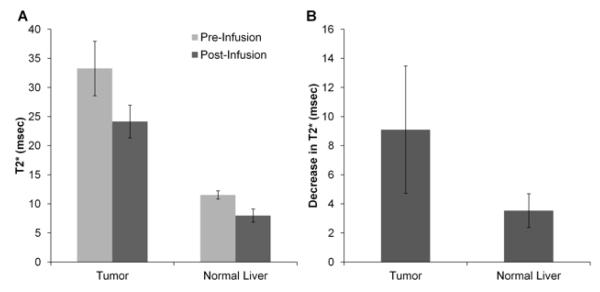
Figure 7.
T2* measurements. A. Bar graph depicting T2* values in tumor and liver tissues before and after SPIO-labeled NK cell infusion. T2* changes were greater in the tumor compared to in the normal liver. B. Bar graph depicting decreases in T2* values after SPIO-labeled NK cell infusion in tumor and normal liver tissues. The T2* decrease was greater in tumor than in normal liver tissues (p<0.05).

