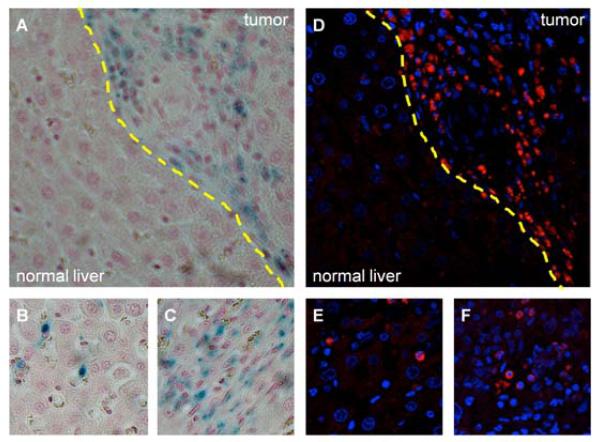
Figure 8.
Microscopy. A – C. 20× original magnification light microscopy. Prussian blue iron stain demonstrates labeled NK cells primarily in the tumor (A, tumor and normal liver separated by dashed yellow line); digital zoom panels illustrate the presence of labeled NKs in both the normal liver (B) and tumor (C). D – F. 40× original magnification fluorescence microscopy. NK cells (blue nuclei surrounded by Texas Red nanoparticles) infiltrating primarily tumor tissue (D, tumor and normal liver separated by dashed yellow line); digital zoom panels illustrate the presence of labeled NKs in both the normal liver (E) and tumor (F). Light microscopy and fluorescence views are of corresponding sections; note the similar distribution of SPIO-labeled NK lymphocytes between A and D.

