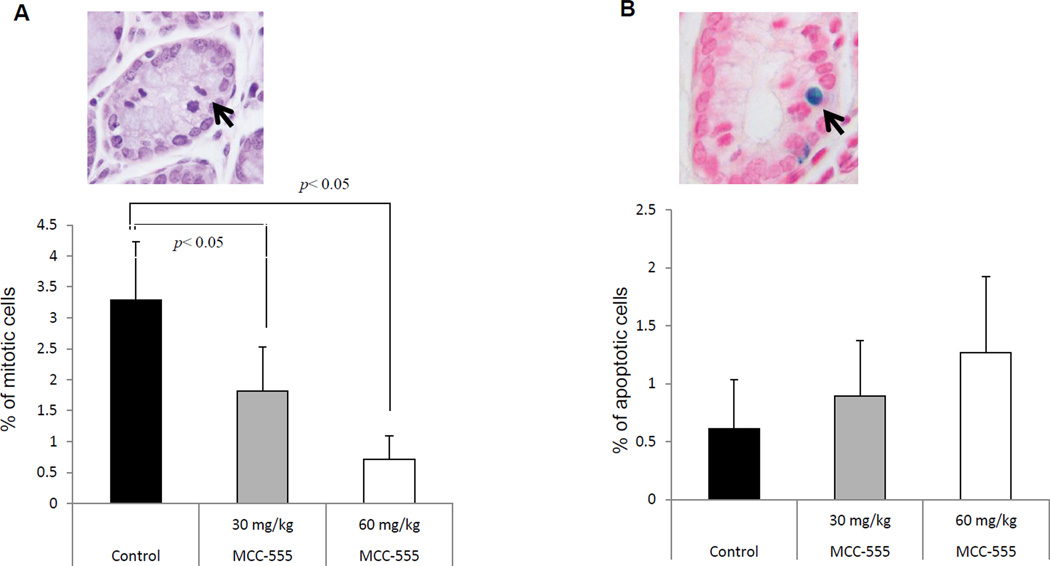
Fig. 3.
Mitosis and apoptosis in the colonic crypts of AOM-induced A/J mice treated with MCC-555. (A) To quantify mitosis, we calculated the percentage of the crypt count with mitosis from total cell count in the crypt. A representative mitotic cell is shown in the top. (B) To quantify the apoptotic cells, we randomly calculated the TdT-positive cell count under a magnification of ×100. A representative apoptotic cells have shown in the top. Results were expressed as mean ± SEM. ANOVA was used with Tukey post hoc analysis. The results were considered statistically significant at p < 0.05.

