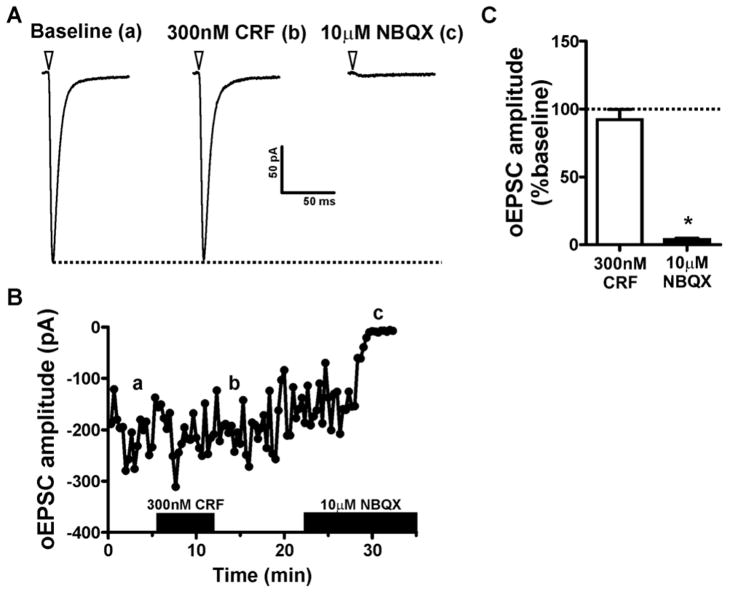
Figure 3. CRF has no effect on optically evoked EPSCs in the CeAL.
(A) Example traces of optically evoked EPSC amplitude during baseline, after CRF application or after application of the AMPA receptor antagonist NBQX. Each trace is an average of 10 consecutive sweeps taken from the time course shown in B. Dotted line indicates peak EPSC amplitude during baseline. Inverted triangle indicates onset of optical stimulation. (B). Time course from exemplar cell shown in A indicating a lack of effect of CRF on optically evoked EPSC amplitude. Traces in A correspond to the lower case letters shown in B. Black bars on x-axis indicate time-points during which drugs were applied. (C) Bar graph summarizing the effect of CRF and NBQX on optically evoked EPSC amplitude. Dotted line indicates normalized baseline values. * indicates significant difference from baseline (p<0.05).

