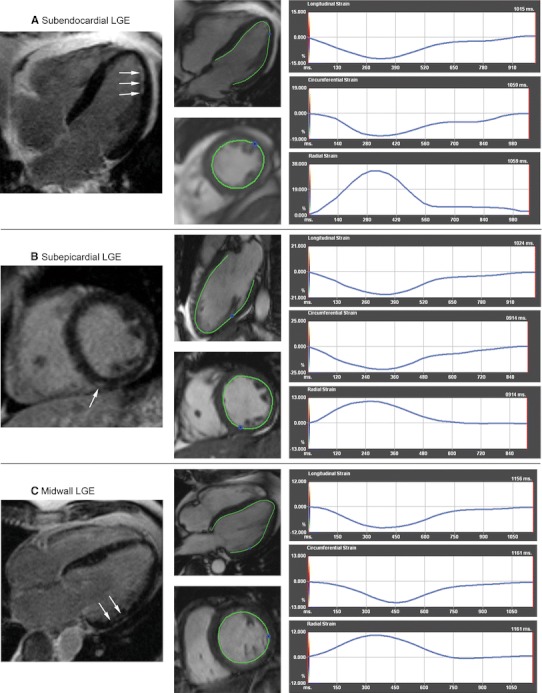
Fig. 3.

Peak-systolic strain (εps) with regard to the spatial distribution of late gadolinium enhancement (LGE) lesions (arrows) in subjects with Churg–Strauss syndrome (CSS) (a, c) and granulomatosis with polyangiitis (Wegener’s) (WG) (b). εps was decreased longitudinally for subendocardial LGE (a), radially for subepicardial LGE (b), and circumferentially, longitudinally and radially for midwall LGE (c) lesions
