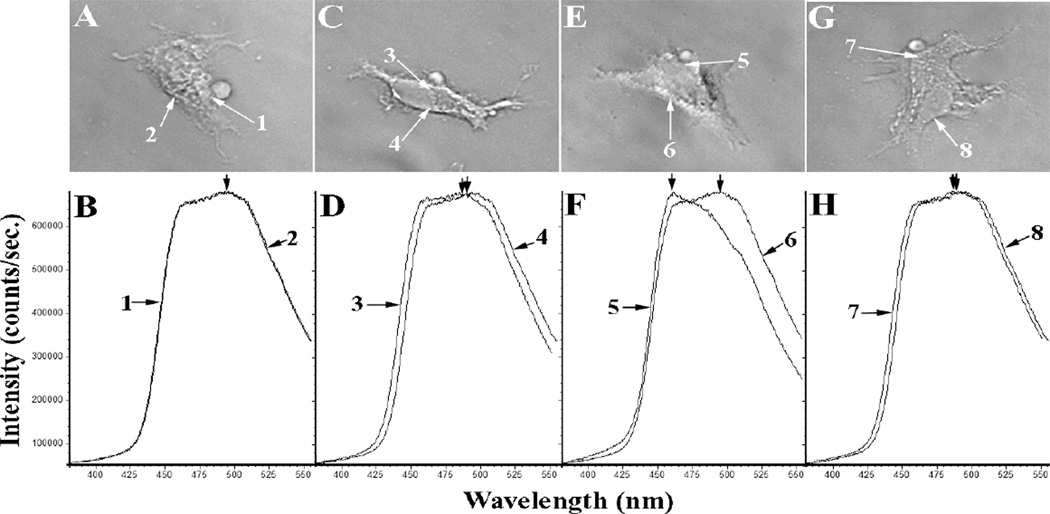
Figure 1. Lipid-ordered membrane domains in association with sites of phagocytosis in COS-1 cells expressing FcγRIIA, FcγRIIA/vector, FcγRIIA/hCERK, and FcγRIIA/G198DhCERK.
COS-1 cells were labeled with Laurdan. Regions 1, 3, 5, and 7 (panels A,C,E, and G) correspond to membrane areas participating in phagocytosis. The Laurdan emission spectra for those regions are denoted with the same numbers as shown below each micrograph. FcγRIIA cells demonstrated a 0-nm shift (panel B), and the cells treated with FcγRIIA/vector demonstrated a ~3-nm shift (panel D). The FcγRIIA/hCERK transfectants exhibited a shift in emission maximum of ~37 nm (panel F), and FcγRIIA/G198DhCERK-transfected cells (panel G) exhibited a shift in the emission of 2.2+0.6-nm shift (panel H). Quantitatively, the calculated general polarization of membrane regions 1, 2, 3, 6, and 7 were (-0.030), region 8 was (-0.024), region 4 was (-0.016), and membrane regions 5 was (+0.088). Fifteen separate spectra were averaged to generate the spectra shown in panels B, D, F, and H. The difference in both emission maximum and general polarization was highly significant.

