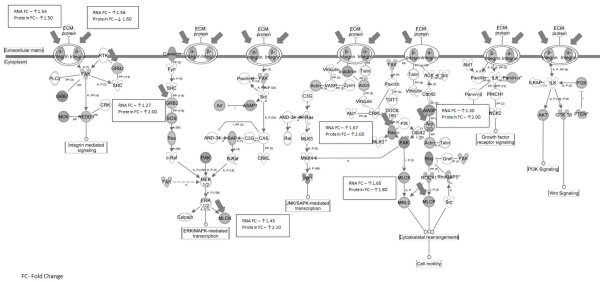
Figure 1.

Integrin pathway molecules identified by the analysis of statistically significant genes between subjects without CAN/IFTA vs. those with CAN/IFTA. Genes in grey are differentially expressed whereas genes in white are not significantly differentially expressed. It is evident that most genes of the integrin pathway are differentially expressed in CAN/IFTA. The genes that are marked with thick arrows were differentially expressed both at the mRNA level as well as at the protein level by tandem mass spectroscopy proteomics. Protein levels were estimated in this study by using the accumulation of spectral counts for each detected protein as we have previously published [31].
