
Figure 2.
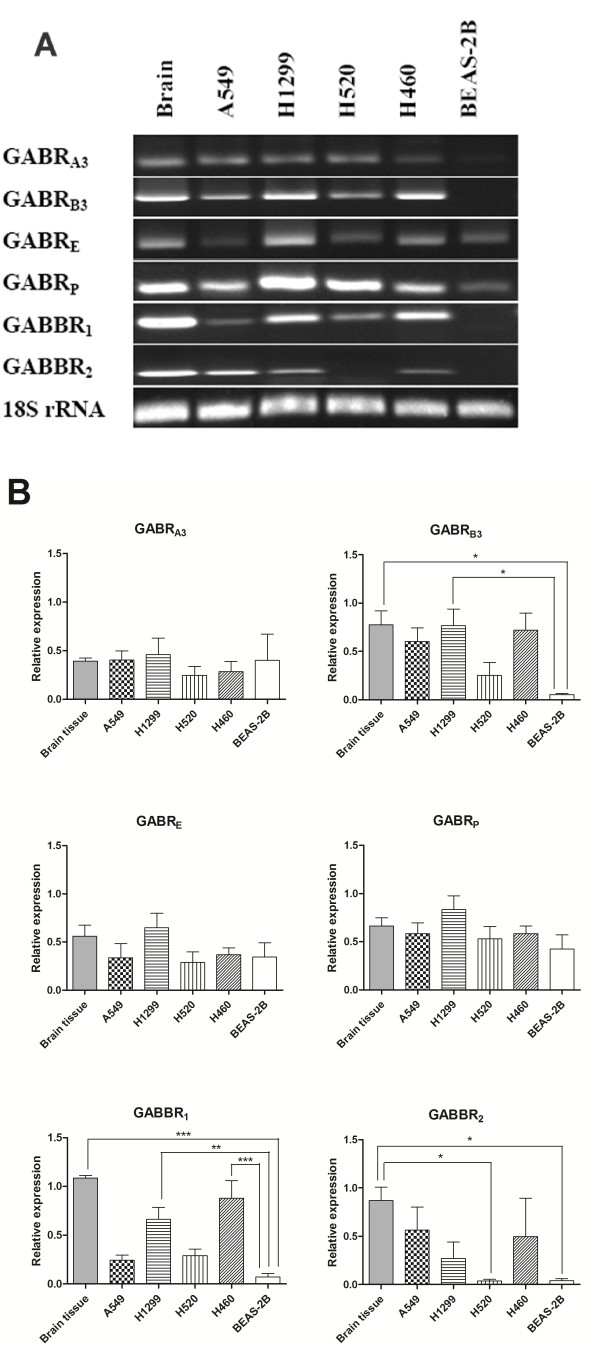
The mRNA profile of GABA receptors in NSCLC cell lines. Figure 2A show that GABRA3, GABRB3, GABRE, GABRP, GABBR1 and GABBR2 ecpress in NSCLC cell lines. Brain expression acts as a positive control and BEAS-2B as a negative control. Figure 2B show three times of the PCR for gene relative expression. * P < 0.05, ** P < 0.01.