
Figure 3.
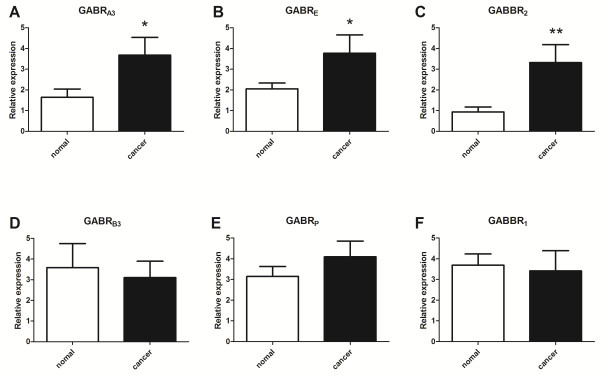
Gene expression levels in all NSCLC tissues and paired non-cancerous tissues. Relative expression is presented as 2-ΔCT ± S.E. The expression of 18S rRNA acts as reference gene. There is a significant increase in gene expression for GABRA3 (*P = 0.030, Figure 3A), GABRE (*P = 0.036, Figure 3B) and GABBR2 (**P = 0.005, Figure 3C) in NSCLC tissues, with no difference in expression for GABRB3 (P = 0.742, Figure 3D), GABRP (P = 0.288, Figure 3E) and GABBR1 (P = 0.746, Figure 3F). * P < 0.05, ** P < 0.01.