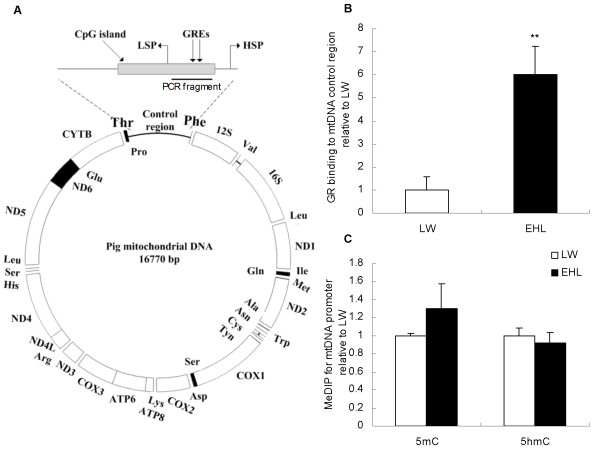
Figure 3.
Schematic structure of pig mtDNA (A), GR binding (B), and DNA (hydroxyl)methylation status of CpG island on the control region of mtDNA (C). Values are mean ± SEM, n = 6/breed. ** means p < 0.01 between breeds; GREs, glucocorticoid response elements; HSP, heavy strand promoter; LSP, light strand promoter.

