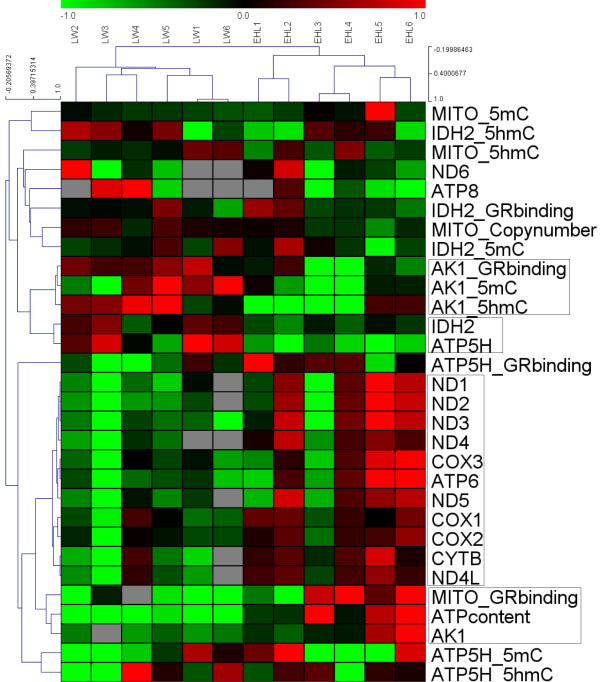
Figure 5.
Hierarchical cluster analysis of the characteristics in liver from Large White (LW) and Erhualian (EHL) piglets. The figure was drawn by MeV software (version 4.2.6). Correlation (centred) similarity matrix and average linkage algorithms were used in the cluster analysis. Each row represents an individual characteristic, and each column represents a sample. The dendrogram at the left side and the top displays similarity of expression among characteristics and samples individually. The color legend represents the characteristic level, with red indicating high expression levels and green indicating low expression levels, while the gray blocks in the figure indicate missing values. The codes on the legend are log2-transformed values.

