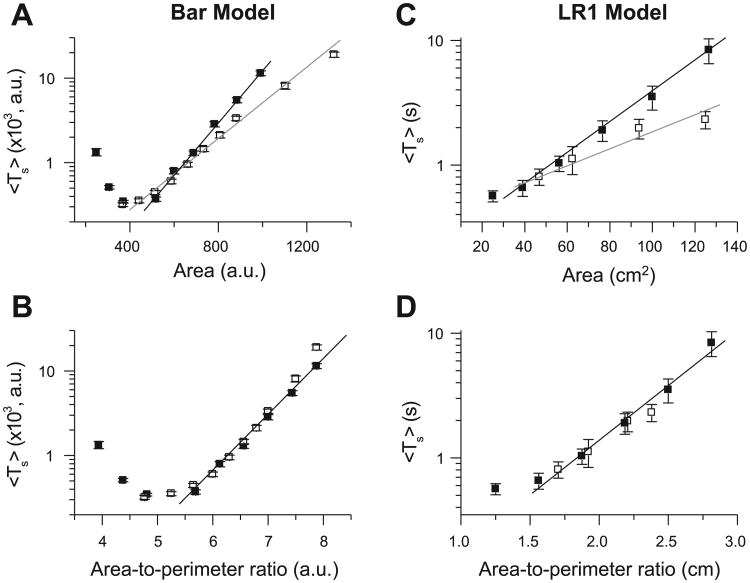
Fig. 5.
Effects of tissue size and geometry on Ts in homogeneous tissue. A and B: Ts vs. tissue area and area-to-perimeter ratio, respectively, for the Bär model. ■, Square tissue; □, rectangular tissue with one side fixed at 21 arbitrary units (AU). C and D: Ts vs. tissue area and area-to-perimeter ratio, respectively, for the LR1 model with the black APD restitution curve in Fig. 3A. Fixed side for rectangular tissue is 6.25 cm. [Theoretically, the function y = a + exp(αx2) should not also be the function y = b + exp(βx), but for a small range of x, a data set may well fit both functions, which may be the case here.]

