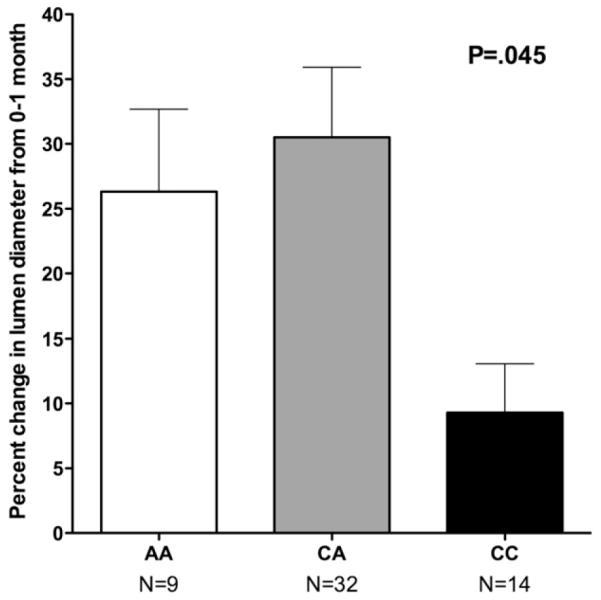
Fig 3.

Percentage change (mean ± standard deviation) is shown in vein graft lumen diameter from baseline (intraoperative after implantation) to 1 month, in a subset of 55 patients who took part in a detailed ultrasound imaging substudy,18 by p27Kip1-838 genotype (P = .045 by analysis of variance).
