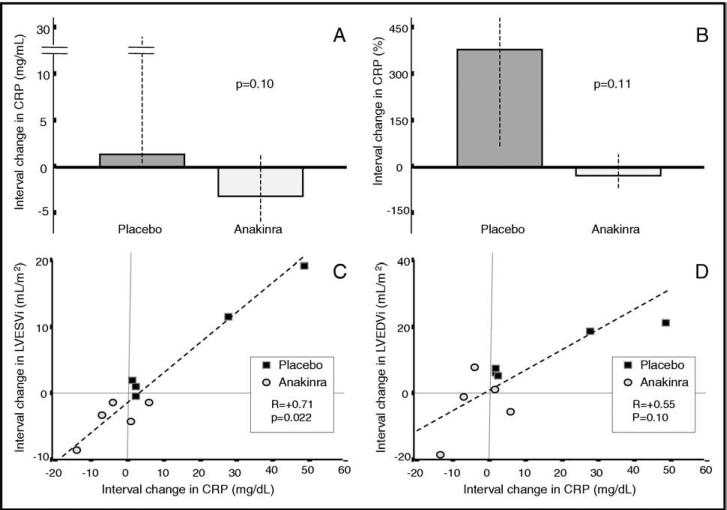
Figure 4.
C-reactive protein changes and LV remodeling. (A,B) Median interval changes in C-reactive protein plasma levels 72 hours after admission, expressed as absolute change (mg/dl) or percentage, respectively. (C,D) Correlation between interval change in C-reactive protein plasma levels 72 hours after admission and interval change in LVESVi and LV end-diastolic volume index (LVEDVi) by CMR imaging, respectively.

