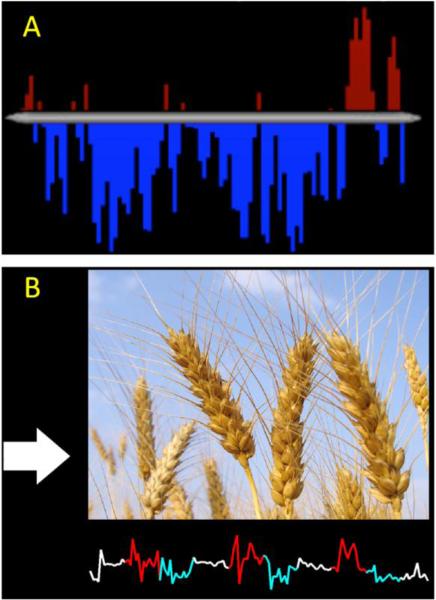
Figure 3. Example Front-End components.
A) This Front-End is written in E-Prime and shows feedback from the PCC after addition signal processing. The BOLD time-course from the PCC is shown as a bar graph with red bars representing an increase over baseline and blue bars representing a decrease under baseline. B) This Front-End is written is Matlab and shows both activation of the OFC cortex and images designed to provoke or subdue contamination related anxiety (the wheat in this example). These Front-Ends used in ongoing rt-fMRI experiments show the flexibility of our system to feedback design.

