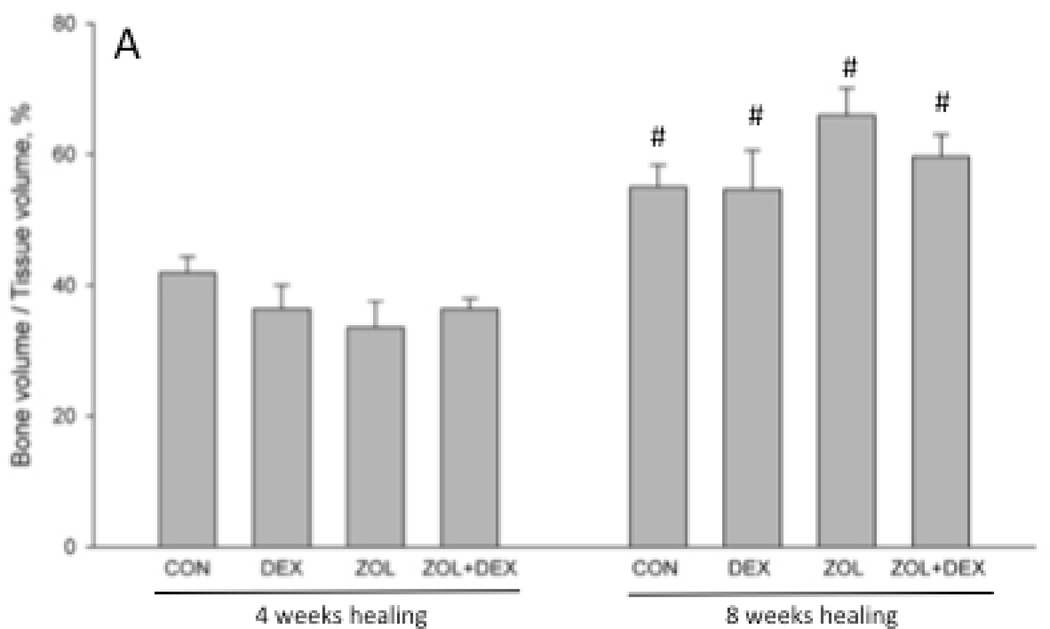
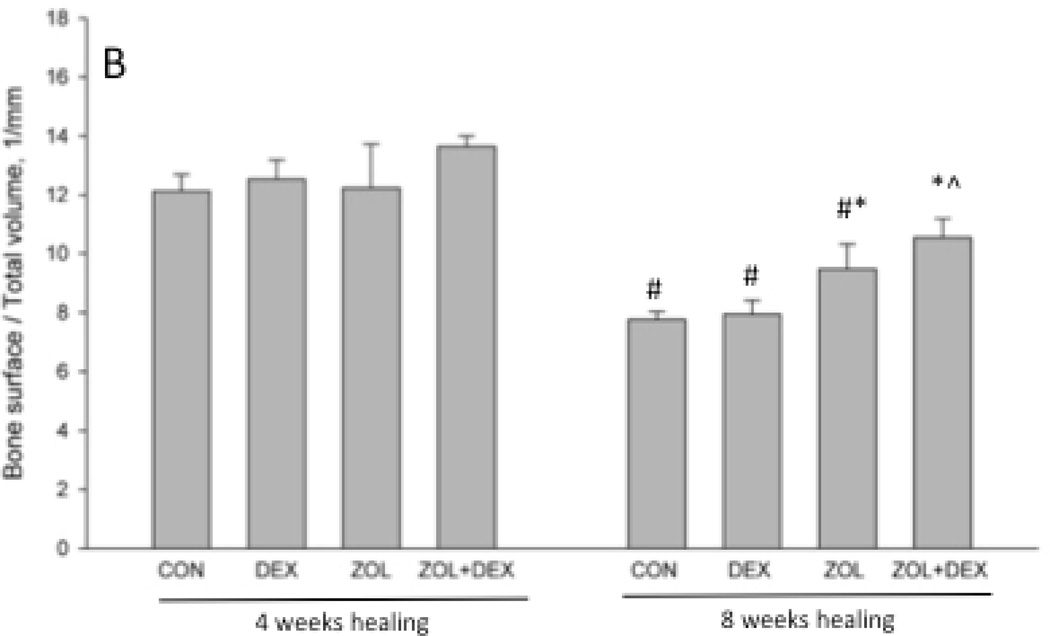
Figure 3.
Micro-computed tomography assessment of the extraction site osseous healing. Three-dimensional analysis of the entire socket region support document that after 4 weeks of healing there was no difference in bone volume/tissue volume (BV/TV, %) or bone surface/total volume among the groups. After 8 weeks of healing, BV/TV was significantly higher in all treatment groups compared to the 4 week time-point. Bone surface / total volume (BS/TV) was significantly lower at 8 weeks compared to 4 weeks in CON, DEX, and ZOL groups but not ZOL+DEX. At the 8-week time point BS/TV was significantly higher in ZOL and ZOL+DEX compared to CON. p < 0.05 versus 4 week time-point within group (#), versus CON-treatment within time point (*), or versus DEX- treatment within time point (^).


