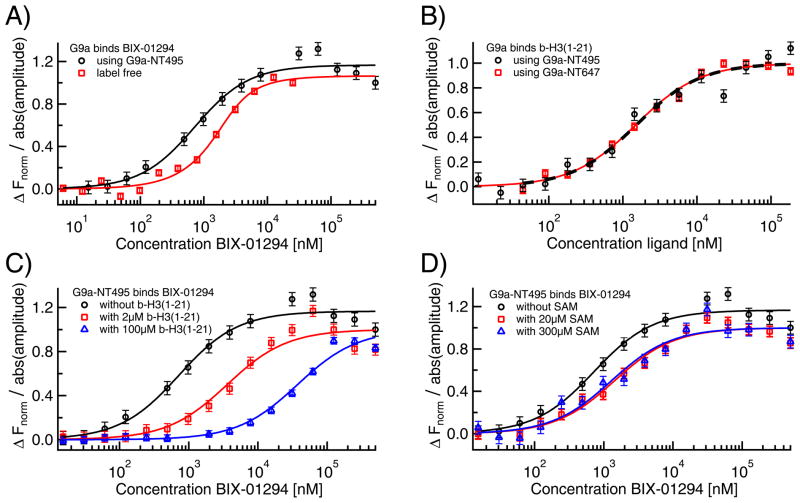
Fig. 8. MST analysis of small molecule binding to G9a.
A) The specific interaction of the small molecule BIX-01294 to G9a was quantified via label-free MST (red squares) as well as standard MST with a NT495-label (black circles), where the results were in excellent agreement with each other (KD=0.7±0.2 μM for both) and confirmed previously reported ITC measurements. B) The affinity of the peptide b-H3(1–21) to both G9a-NT495 (black circles) and G9a-NT647 (red squares) was quantified via MST yielding identical KDs (1.5±0.4 μM for G9a-NT495 and 1.5±0.2 μM for G9a-NT647). C) Pre-incubating G9a with b-H3(1–21) right-shifted the KD for BIX-01294 from 0.7 μM (black circles) to 4±1 μM in presence of 2 μM (red squares) and to 37±7 μM (blue triangles) in presence of 100 μM of the peptide suggesting competition at the histone binding site. D) In contrast, addition of SAM in concentrations of 20 μM (KD=1.4±0.3 μM, red squares) and 300 μM (KD=1.2±0.4 μM, blue triangles) only had a minor effect on the apparent KD of BIX-01294 to G9a.

