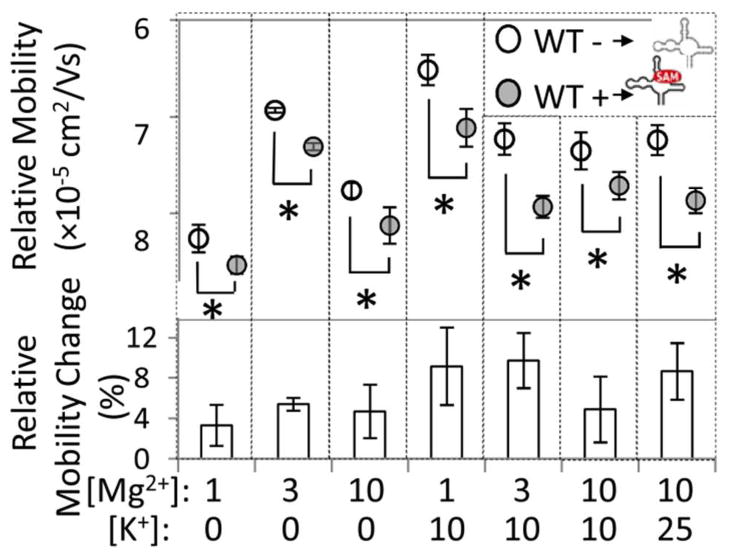
Figure 4.
Screening for the effect of Mg2+ and K+ concentration on Bs SAM-I riboswitch mobility and the extent of the mobility shift in the presence of SAM ligand. All on-chip mobility shifts are statistically significant using a two tailed t-test (p<0.05) and indicated by ‘*’. Relative mobility change is the % increase in RNA mobility in the presence of SAM. WT− and WT+ indicate the absence and presence of SAM ligand, respectively. Error bars are standard deviation of triplicate runs. All runs were done in 1× TB buffer with salt concentrations as indicated in mM.

