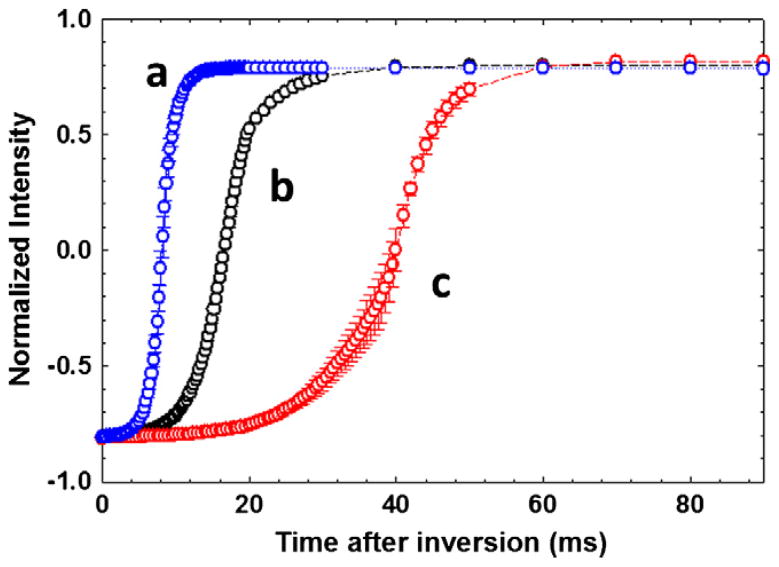
Fig. 6.
Plot of the recovery of water magnetization after inversion due to radiation damping in (a) standard 5 mm (saddle) indirect detection probe (5 mm IDPFG, 550 mL, blue), (b) microcoil (solenoid) NMR probe (25 μL, black) and (c) standard 8 mm (saddle) triple resonance probe (8 mm TR-PFG, 730 mL, red). The Intensity along the Y-axis is the area under the water resonance and the recovery time is along the X-axis. The error bars determine the standard deviation over four consecutive measurements. (remade using the data presented in [78]. (For interpretation of the references to color in this figure legend, the reader is referred to the web version of this article.)

