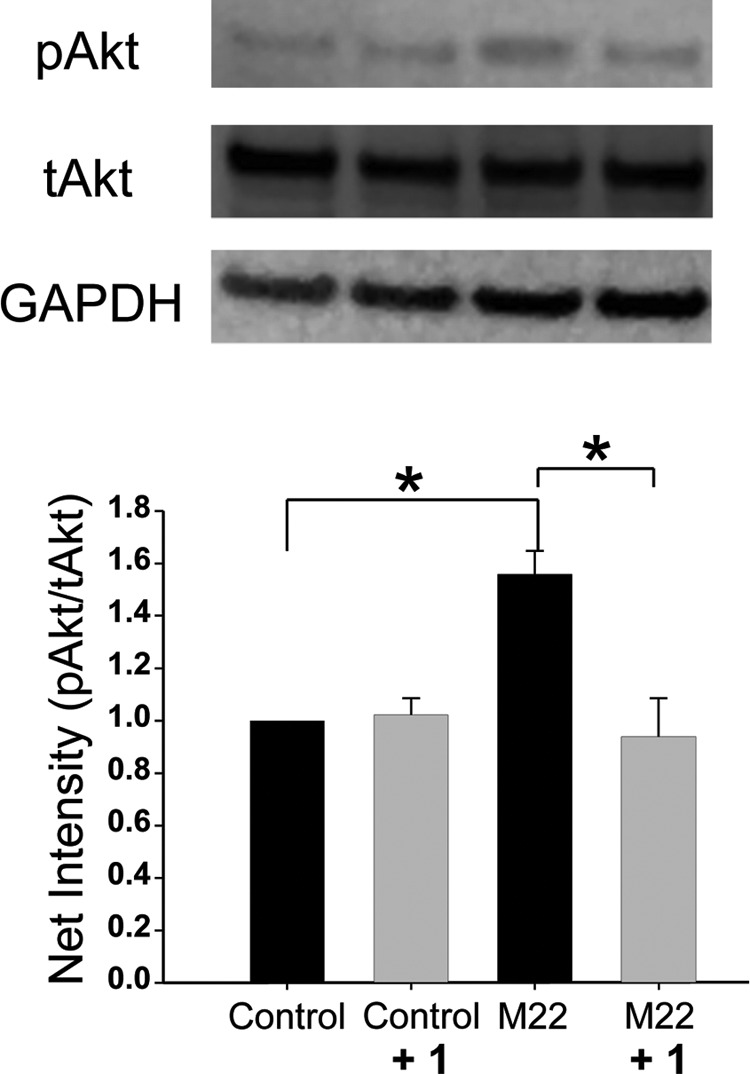
Figure 2.

Top, representative Western blots showing total Akt (tAkt), Ser473 phosphorylated Akt (pAkt), and glyceraldehyde-3-phosphate dehydrogenase (GAPDH) protein bands in confluent undifferentiated GO orbital fibroblast cultures exposed to 1 (30 μM), M22 (100 μg/mL), both treatments, or the control. Bottom, densitometric quantitation of net intensity of bands (pAkt/tAkt) in Western blots (n = 3) is shown.
