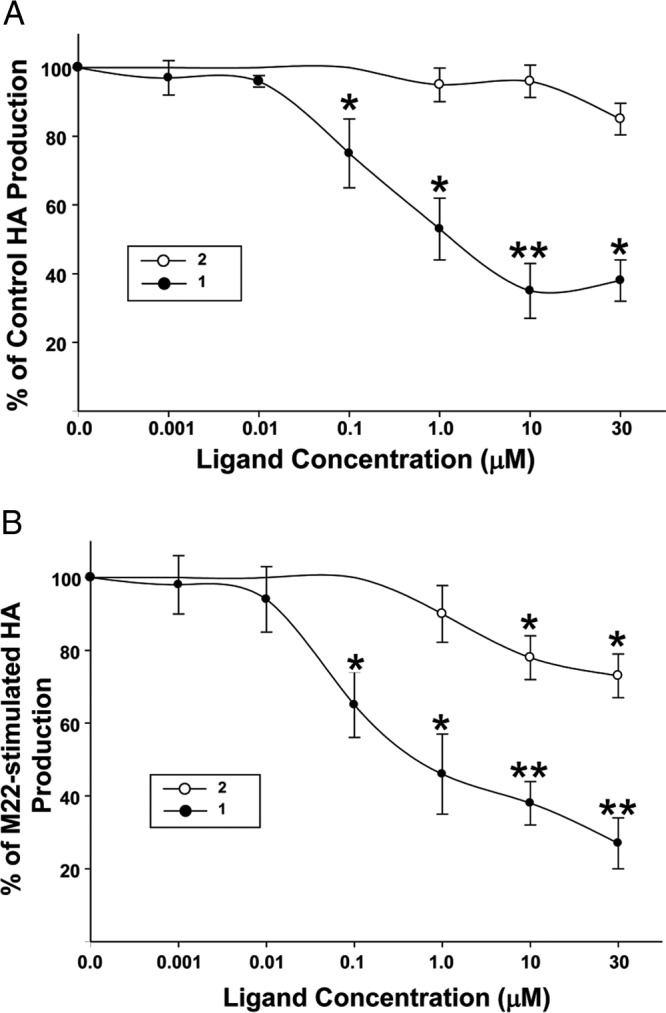
Figure 3.

Impact of the concentration of 1 or 2 on HA production in ligand-independent (A) and M22-stimulated (B) cultures of undifferentiated GO orbital fibroblasts (n = 6). Cultures were treated with 1 (●) or 2 (○) at the indicated concentrations (A) or with M22 (100 μg/mL) plus 1 or 2 at the indicated concentrations (B). Culture media were adjusted to contain the same DMSO concentration as was present in the parallel cultures treated with the various doses of 1 or 2. ELISA results are expressed as percent decrease (mean ± SEM) in HA production relative to that in parallel untreated cultures (A) or percent decrease (mean ± SEM) in HA production relative to that in parallel M22-treated cultures (B). *P < .05; **P < .001, for inhibition of HA production relative to that of parallel untreated cultures or to that of parallel M22-treated cultures without 1 or 2 (*P < .05).
