
Figure 2.
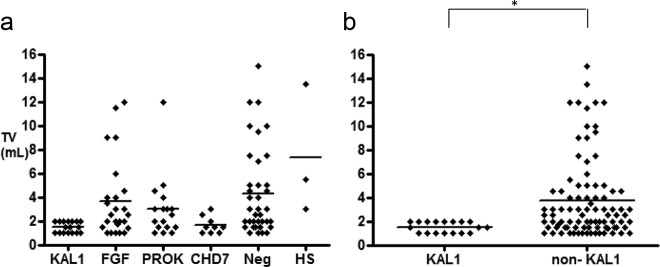
Pubertal severity at presentation in male KS probands. A, Individual values of TV at presentation in male probands within each gene/signaling group. Prepubertal TV less than 4 mL and pubertal TV of 4 mL or greater. KAL1, KAL1; FGF, FGF8/FGFR1 signaling pathway; PROK, PROK2/PROKR2 signaling pathway; CHD7, CHD7; Neg, gene–negative group; HS, HS6ST1. B, Comparison of individual TV at presentation between probands harboring KAL1 mutations (KAL1 group) vs probands who were negative for KAL1 mutations (non-KAL1 group). *P < .05