
Figure 3.
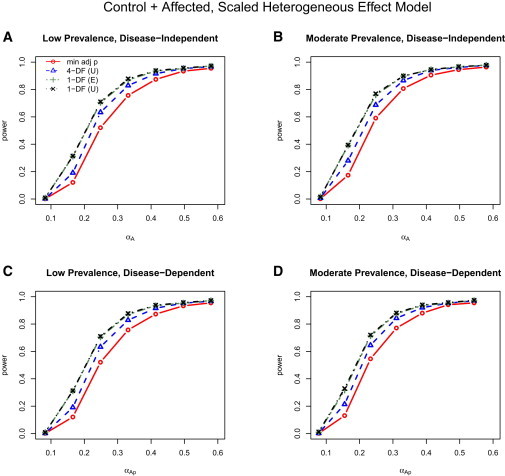
Power for Control + Affected Analysis under the Scaled Heterogeneous Effect Model
Power results for control + affected analysis from the scaled heterogeneous effect data-generation model for both the low (left; A, C) and moderate (right; B, D) disease prevalences and same (top; A, B) and different (bottom; C, D) SNP effects for the affected and control individuals; that is, columns compare power with low versus moderate disease prevalences, and, thus, the effects of the weights, , and rows compare power for disease-independent versus disease-dependent . Although the data were generated with an unstructured correlation matrix, three working correlation matrix structures for the joint outcome analyses were considered: I, independent; E, exchangeable; and U, unstructured. Power results were nearly identical with the use of I, E, and U for the 4-DF GEE tests, whereas power results were nearly identical with I and E, but not U, in the 1-DF SMAT; thus, only the results for GEE (U) and SMAT (E and U) are included.