
Figure 4.
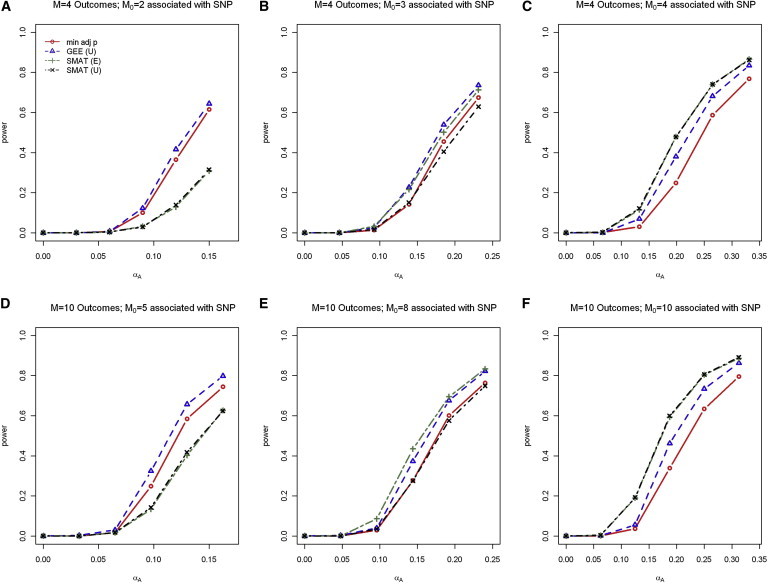
Power when a Subset of Phenotypes Are Associated with SNP
Power results for control-only analysis from the scaled heterogeneous effect model for phenotypes (A–C) and phenotypes (D–F) for various numbers of a subset of phenotypes associated with SNP . Three working correlation matrix structures for the joint outcome analyses were considered: I, independent; E, exchangeable; and U, unstructured. Power results were nearly identical with the use of I, E, and U for the 4-DF GEE tests, whereas power results were nearly identical with I and E, but not U, in the 1-DF SMAT; thus, only the results for GEE (U) and SMAT (E and U) are included.