
Figure 5.
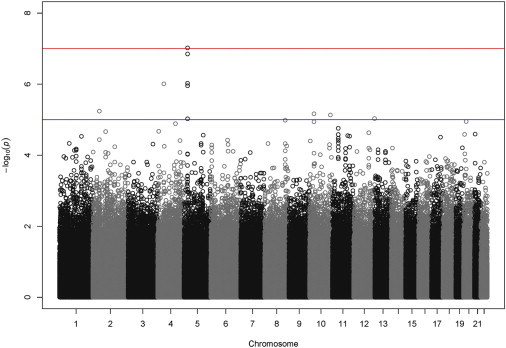
Manhattan Plot of Analysis of Multiple Smoking Behaviors
p values from the 1-DF scaled common effect test SMAT for all SNPs passing quality control. Analysis was performed on both affected and control ever-smokers with the use of to determine the weights and an unstructured working correlation matrix.