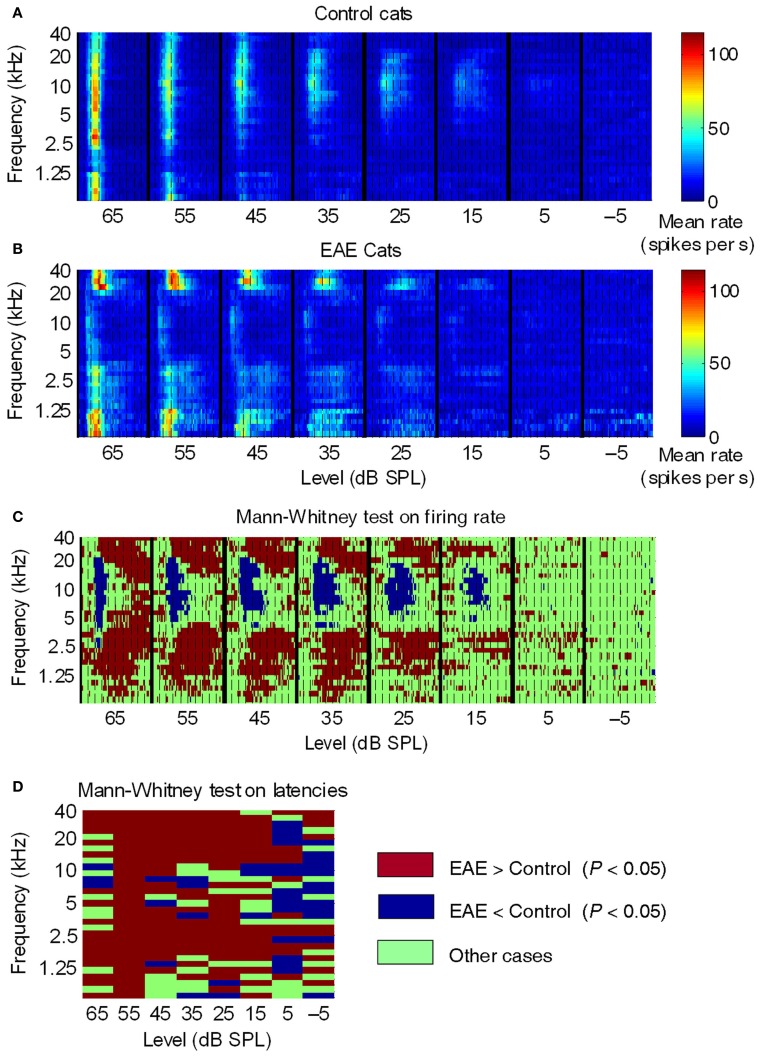
Figure 1.
Averaged post-stimulus time histograms across all control and EAE cats. (A,B) Averaged PSTHs (2-ms time bins) as a function of SPL, over a 100-ms time window, in control, and EAE cats. Dashed lines, 10-ms intervals. Colored bars, mean firing rate. In control cats (A), the mean response suggested that the highest sensitivity (lowest thresholds) was to frequencies around 10 kHz and that the largest responses were to frequencies between 2.5 kHz and 10 kHz. In EAE cats (B), the most sensitive frequencies were those below 1.25 kHz and above 20 kHz. Note that neural responses in EAE cats were much more spread out over time compared to those in control cats. (C,D) Graphical representation of significant differences (Mann-Whitney test) between EAE and control groups in terms of (C) mean firing rate per frequency-latency bin and (D) mean latency per frequency-intensity bin. From Noreña et al. (2006).

