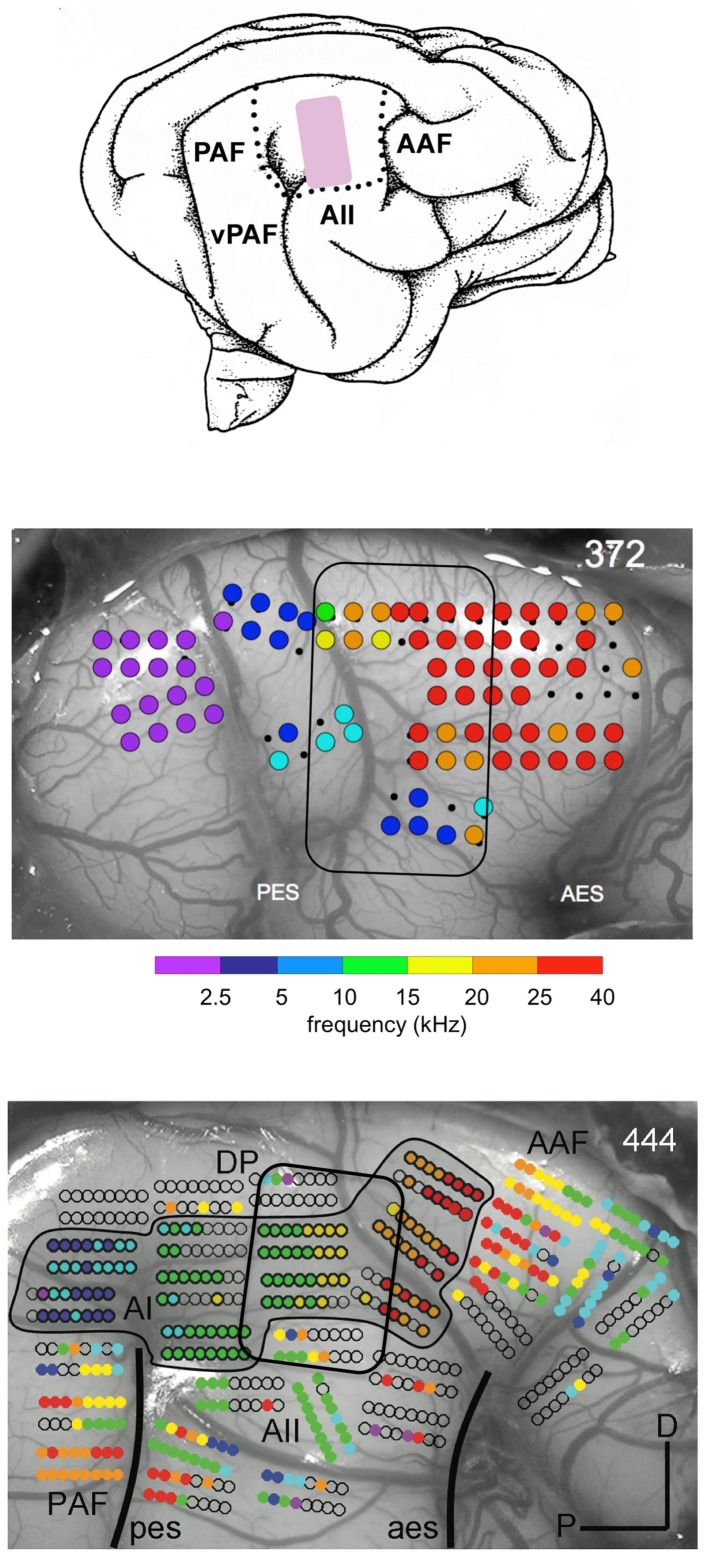
Figure 2.
Map of best frequencies at 65 dB SPL onto the cortical surface in a normal hearing adult cat reared in an enhanced acoustic environment (4–20 kHz) presented for at least 5 mo at 80 dB SPL (middle panel). For comparison the map in an unexposed normal hearing cat is shown in the bottom panel. The cartoon of the auditory fields (top panel) indicates the region (pink) where the 4–20 kHz are normally represented. In the outlined region in the EAE cat there is a lack of responses to frequencies in the range of 5–20 kHz and an overrepresentation of frequencies above 25 kHz. From Eggermont (2008) and Pienkowski and Eggermont (2012).

