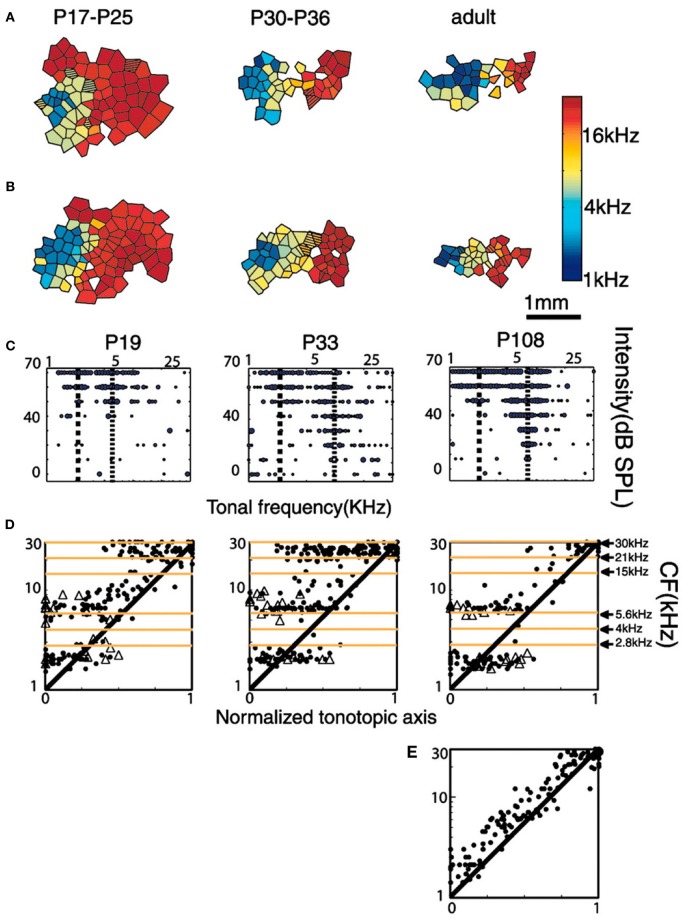
Figure 6.
Tonotopic organization of A1 of rats exposed to a tone sequence with two specific spectro-temporal patterns at different post-natal ages. (A,B) Examples are auditory maps from two different rat litters reared in the critical period (P9–P30) in the presence of these sequences of sound stimuli. Post-natal ages of rats are indicated at the top of each map. (C) Representative tonal receptive fields obtained from A1 at different ages. Dotted lines indicate the positions of peaks within the receptive field. (D) Distribution of CFs (represented by solid dots) and frequencies of secondary peaks (ρ) along the tonotopic axis of the auditory cortex at different developmental stages. Note the regions of tonal stimulation indicated at the right-most graph. Also note that especially for the low-frequency tones (2.8, 4, and 5.6 kHz) the responses between 2.8 and 5.6 kHz are suppressed and those below 2.8 kHz and above 5.6 kHz are enhanced. (E) Distribution along the tonotopic axis of the auditory cortex in control naive adult rats (P100). Reprinted from Nakahara et al. (2004), with permission from National Academy of Sciences, USA.

