
Fig. 1.
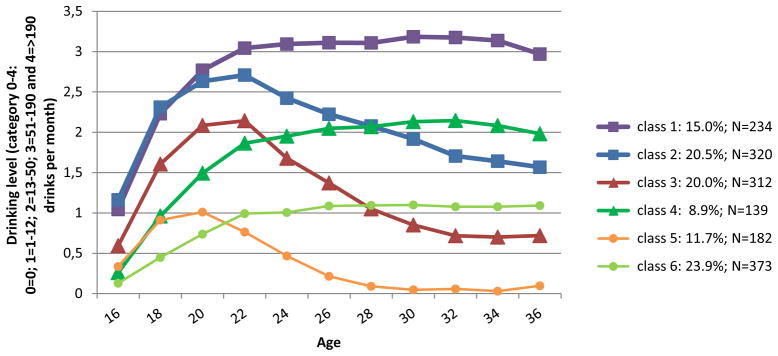
Best fitting model with 6 latent trajectories of alcohol use. Each measurement point represents the amount of consumed alcohol units (in categories) per month averaged over a period of 2 years (resulting in 11 time points for age 15 to 16; 17 to 18; 19 to 20; 21 to 22; 23 to 24; 25 to 26; 27 to 28; 29 to 30; 31 to 32; 33 to 34; and 35 to 36, here indicated by the age at the end of each period).