
Figure 3.
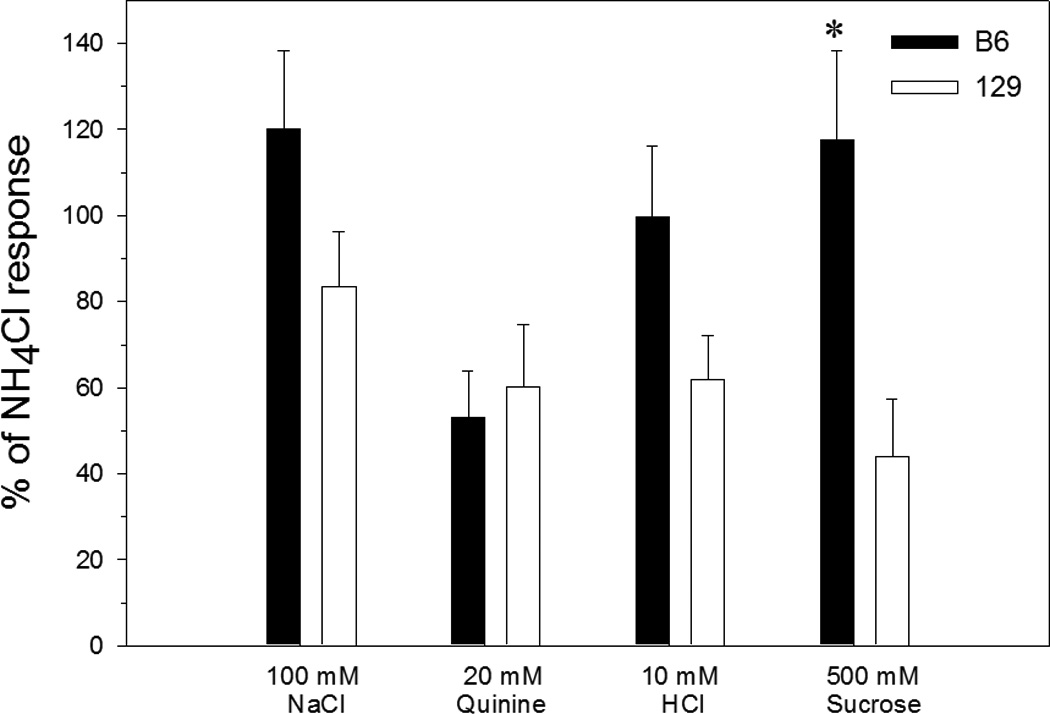
Mean (± SEM) whole nerve chorda tympani responses in B6 (closed bars) and 129 (open bars) mice in experiment 2, expressed as a percentage of the response to 100 mM NH4Cl. *, p < 0.05, B6 vs 129.
Official websites use .gov
A
.gov website belongs to an official
government organization in the United States.
Secure .gov websites use HTTPS
A lock (
) or https:// means you've safely
connected to the .gov website. Share sensitive
information only on official, secure websites.
Mean (± SEM) whole nerve chorda tympani responses in B6 (closed bars) and 129 (open bars) mice in experiment 2, expressed as a percentage of the response to 100 mM NH4Cl. *, p < 0.05, B6 vs 129.