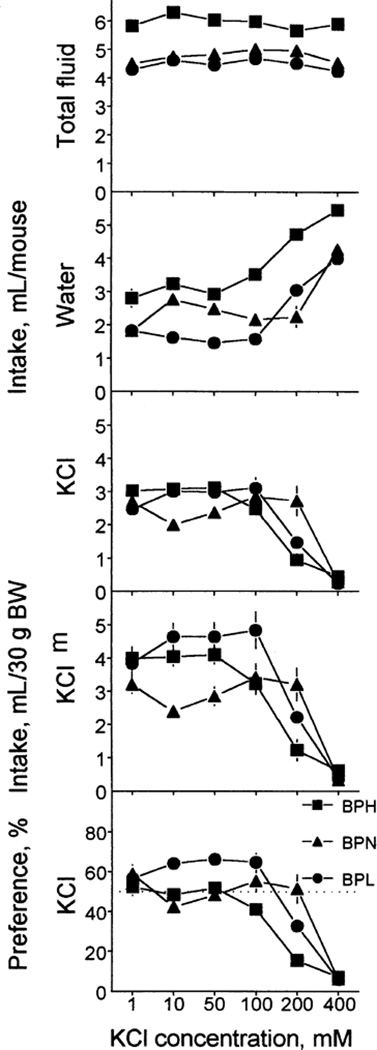
FIG. 4.
Fluid intake (upper four rows) and KCl preference (bottom row) of BPH, BPN and BPL mice. KCl solutions were tested in the ascending order of concentrations. Each concentration was tested in a 48-h test. Intakes were expressed per mouse (top three rows) or per 30 g of BW (fourth row). Vertical bars represent SE.

