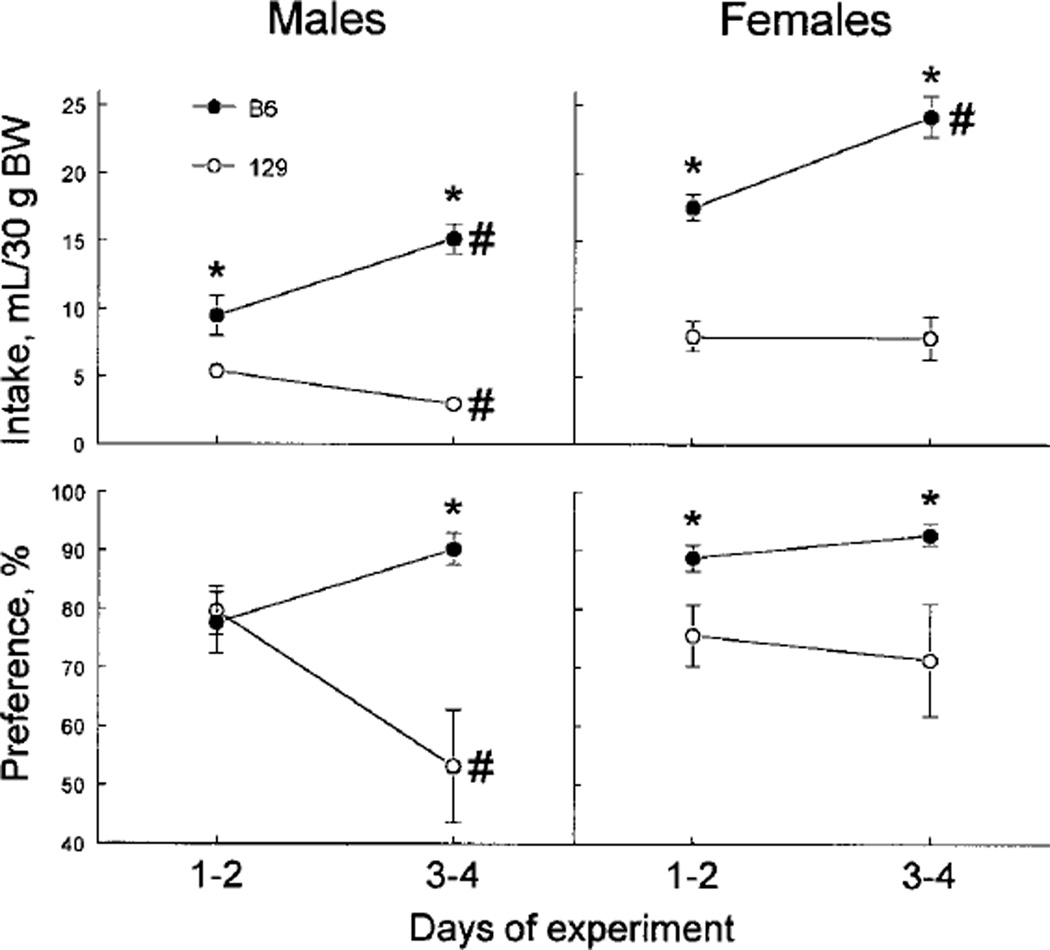
FIGURE 2.
Changes of average daily 300 mmol/L monosodium glutamate (MSG) intake (upper panel) and preference (lower panel) by B6 and 129 mice during 96-h two-bottle preference tests (Experiment 3). Vertical bars represent sem. *Significant difference between B6 and 129 mice (P < 0.05, planned comparisons). #Significant difference between d 1–2 and d 3–4 of the test (P < 0.05, planned comparisons).

