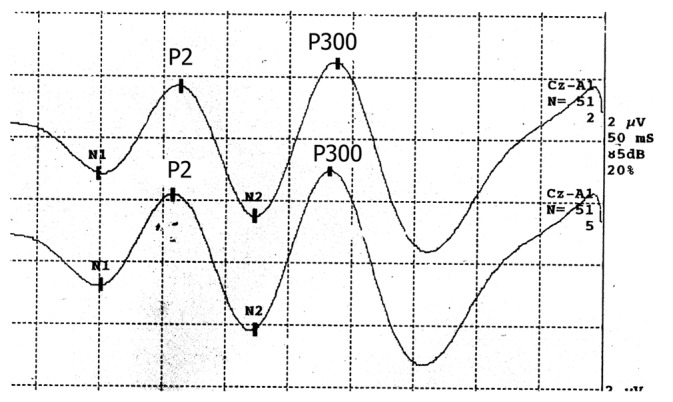
Figure 2.

Event-related potential pattern with a rare tone stimulus: A negative N1, followed by positive apparent P2, again followed by negative N2–positive P300 complex (representing, in part, the event-related response) is seen. The latency of N2–P300 and amplitude of P300 wave is used for analysis purpose.
