Figure 1.

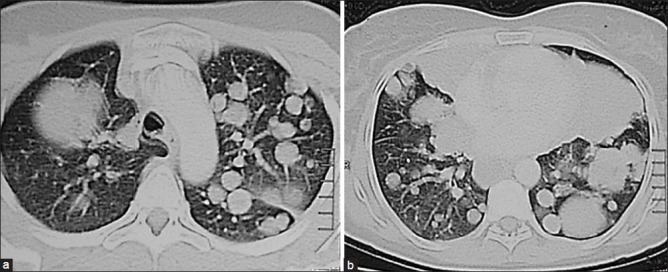
Chest computed tomogram at the upper lobe (a) and the lower lobe (b) levels showing bilateral multiple variable-sized pulmonary nodules

Chest computed tomogram at the upper lobe (a) and the lower lobe (b) levels showing bilateral multiple variable-sized pulmonary nodules