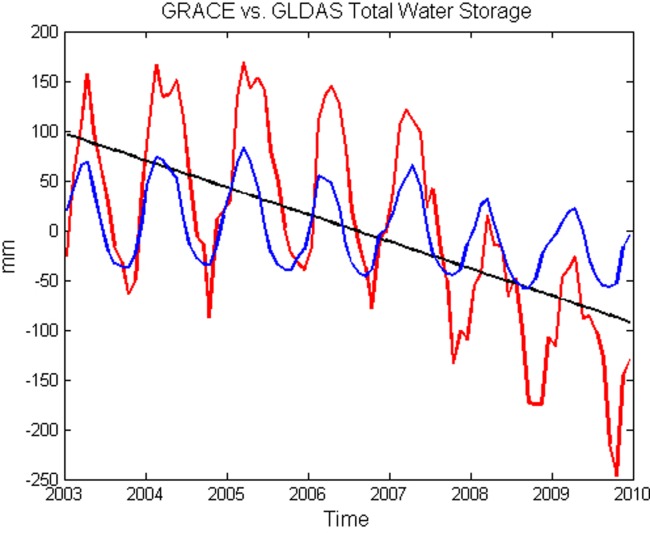
Figure 2.

Total water storage anomaly (combined precipitation, evapotranspiration, and streamflow time series) produced by GLDAS when compared with GRACE total water storage anomaly for the TEWI region in Figure 1, from January 2003 to December 2009. The blue line is GLDAS total water storage, the red line is GRACE total water storage, and the black line is the GRACE total water storage trend (−27.2±0.6 mm yr−1). The associated error for GLDAS total water storage is the mean monthly standard deviation from the three land surface models used (Vic, Noah, and CLM2), whereas the GRACE total water storage monthly error is 11.3 mm for every month, which is the sum error from scaling and leakage.
