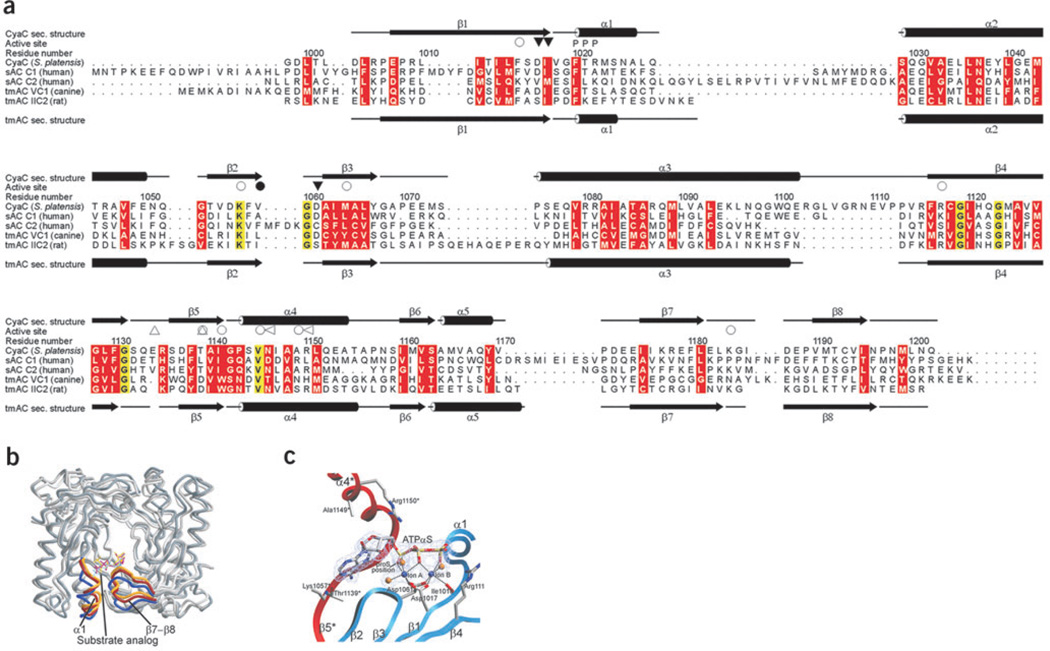
Figure 3.
Conformational states and comparison of AC enzymes. (a) Structure-based sequence alignment of bicarbonate responsive sAC enzymes and the G protein–regulated tmAC domains VC1 and IIC2 (PDB entry 1AZS). Secondary structure elements of sAC and IIC2 are indicated on top and bottom, respectively. Ion-binding residues (▽) and residues binding the substrate (○) or the transition state (◁) are labeled (filled and empty symbols label C1 and C2 residues, respectively). Thr1139* and the insertion characteristic for sAC enzymes are indicated (△). Conserved amino acids are shaded yellow, and residues with conserved physicochemical properties are shaded red. (b) Overlay of the sAC–α,β-Me-ATP structure (open state, darkest gray, with α1 helix and β7–β8 loop in blue), the sAC–Rp-ATPαS complex (partially closed, middle gray and red), and the bicarbonate-soaked Rp-ATPαS structure (closed, lightest gray and yellow). Structures were superimposed on sAC–α,β-Me-ATP by optimizing positional agreement for residues 1014–1018, 1056–1065, 1117–1126 and 1143–1167 in both subunits. (c) sAC active site in complex with Rp-ATPαS and two magnesium ions, with the two monomers colored red and blue, respectively. The dashed lines indicate the octahedral coordination of the ions through the ATP analog, protein residues and one and two water molecules (gold spheres), respectively. The 2Fo − Fc omit electron density for the ligands was contoured at 1.1 σ. In its tmAC complex, Pα of Rp-ATPαS was modeled differently but with limited electron density for the ribose and its link to the Pα16, and we speculate that this density might also be interpretable with the inhibitor conformation observed here for its sAC complex.

