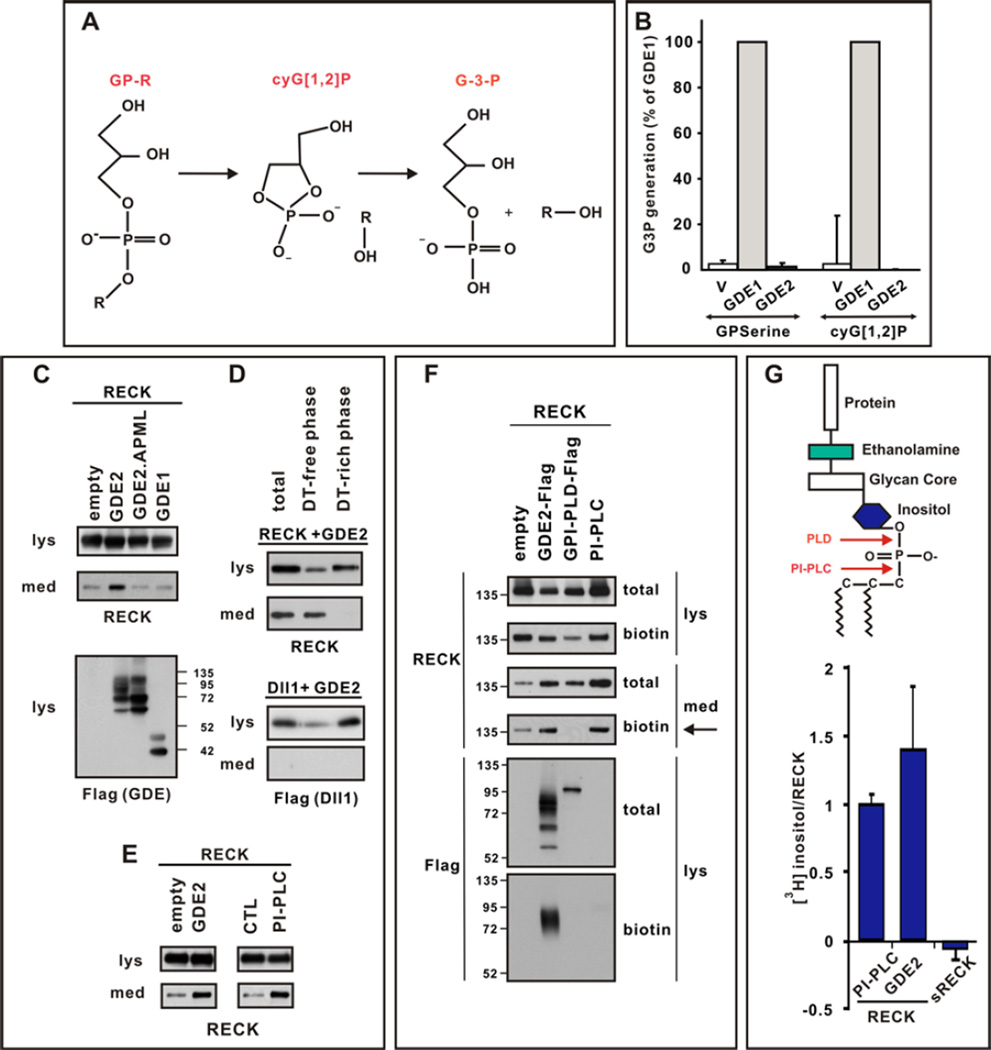
Figure 3. GDE2 cleaves RECK within the GPI-anchor.
(A) Schematic of 2-step GDPD catalysis. (B) Graph quantifying in vitro GDPD assay in transfected HEK293T cells using glycerophosphoserine (GPserine) and synthetic cyclic glycerol[1,2] phosphate intermediate. (C–E) Western blots of transfected HEK293T cell lysates (lys) and medium (med). (C) RECK is detected in the medium when catalytically active GDE2 is present. (D) After sequential Triton X-114 extraction cleaved RECK is observed in the Detergent (DT)-free hydrophilic phase, while Dll1, which is not cleaved by GDE2, is retained in DT-rich hydrophobic phase of the lysate. (E) RECK ECD is generated by GDE2 or PI-PLC activities. (F) Western blot of lysates (lys) and medium (med) of HEK293T cells transfected with RECK and C-terminal Flag tagged GDE2 or GPI-PLD. Surface RECK is labeled by biotin. GDE2 but not GPI-PLD releases surface biotinylated RECK into the medium (arrow). Both GDE2 and GPI-PLD are visualized by Flag antibodies but only GDE2 is labeled by biotin indicating GDE2 is localized to the cell surface. PI-PLC was added to intact cells and serves as a positive control. (G) Schematic of GPI-anchor. Graph quantifying amount of radiolabel incorporated into RECK or secreted (s) RECK when GDE2 or PI-PLC is present. Mean ± s.e.m. n=4–12.

