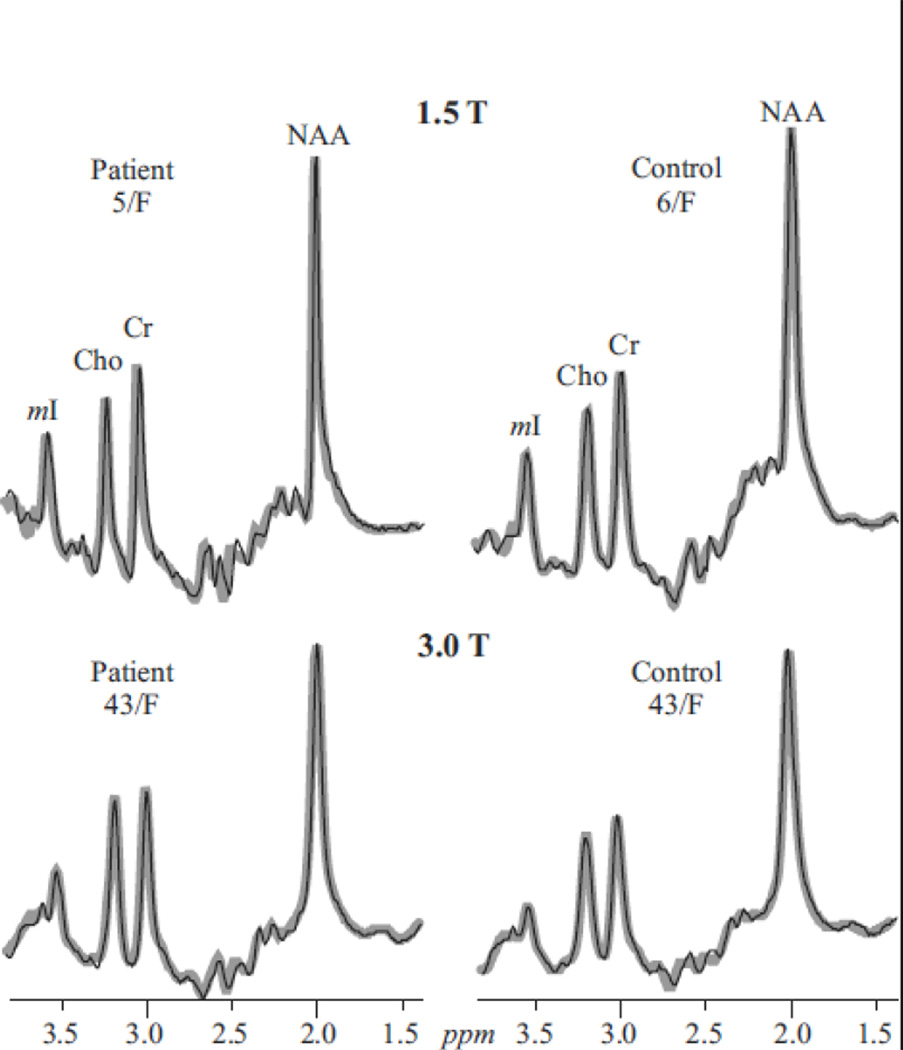
Fig. 4.
Real part of the aligned and globally-averaged 1H spectra from all VOI voxels (thin black lines) representing Eq. [3], for each subject, superimposed with their fitted model functions (thick gray lines), on common intensity (at each field) and chemical shift scales. Note the excellent SNRs and resolution (compared with the single voxels in Figs. 1 and 2) and observable Cho, Cr and mI increases in the adults (See Table 1).

