FIGURE 3.

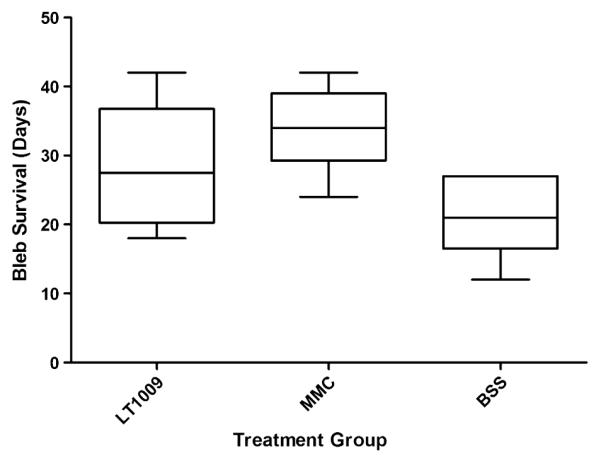
Box plot of bleb survival for each treatment group. First and third quartiles are delineated by the boxes. Whiskers represent maxima and minima.

Box plot of bleb survival for each treatment group. First and third quartiles are delineated by the boxes. Whiskers represent maxima and minima.