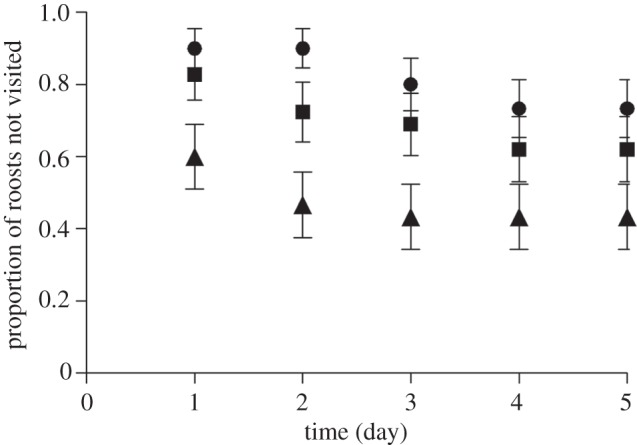
Figure 2.

Proportion of roosts not visited, i.e. ‘survived’ (± s.e.) for observations over a 5 day period. All species visiting roosts are included in this analysis. A roost was removed from the analysis and considered ‘disturbed’ after the first visitation. Circles denote control, squares denote group and triangles denote individual roosts.
