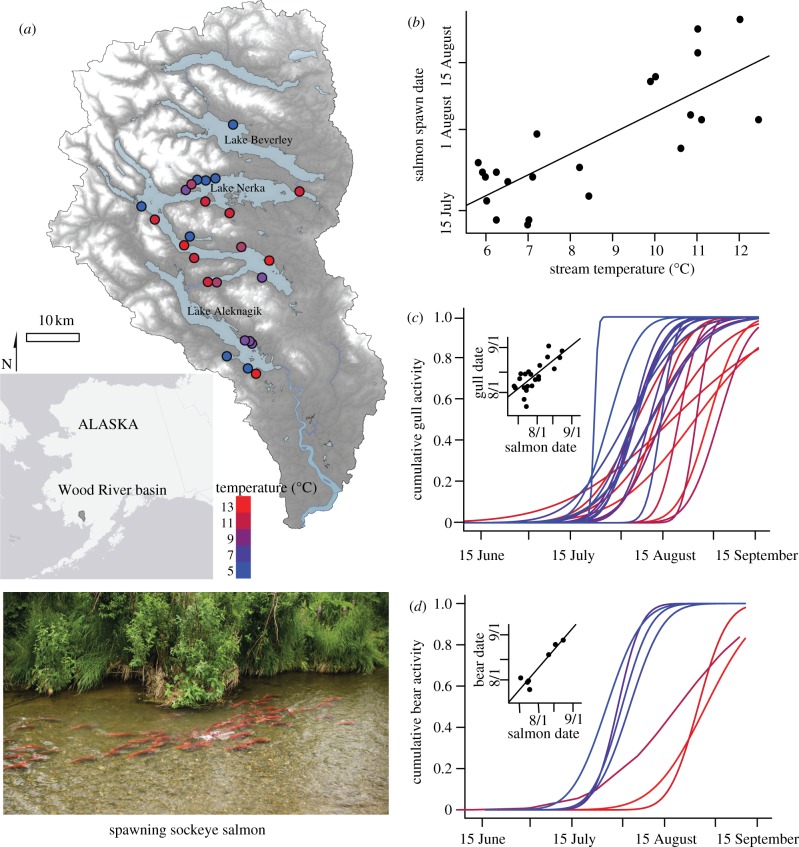
Figure 1.
(a) Map of Wood River basin showing sockeye salmon spawning locations and corresponding average summer water temperature as indicated by dot colour. (b) Relationship between water temperature and sockeye salmon spawning date. (c,d) Cumulative distribution functions (cdf), representing the proportion of the cumulative seasonal activity observed at any site on a specific date, for (c) gulls and (d) bears at sockeye salmon spawning locations. Colours of lines correspond to water temperatures, and insets show relationship between the mean of the cdf for gulls and bears, and sockeye salmon spawn timing among study sites (see the electronic supplementary material, table S1).

