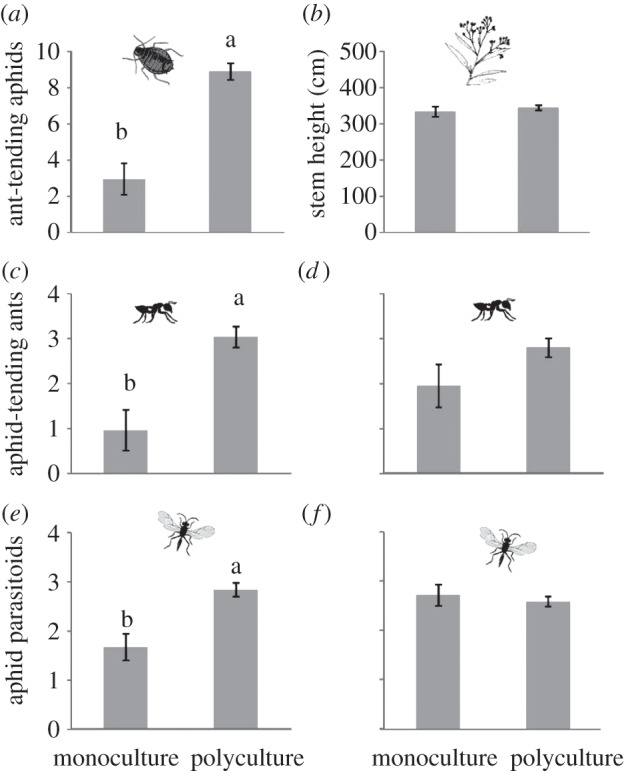
Figure 2.

Effect of plant genetic diversity (monocultures versus polycultures) on (a) ant-tended aphids, (b) total stem height in cm, (c,d) aphid-tending ants and (e,f) aphid parasitoids. Total abundance (mean number per plant) was used to evaluate associated arthropods. To remove the density-mediated indirect effect of aphids on ants and parasitoids, we used aphid abundance as a covariate in the statistical model (d,f). Least-square means ± s.e. (n = 32) are shown, except for ants (n = 16). Different letters indicate significant differences (p < 0.05) among genetic diversity treatments.
