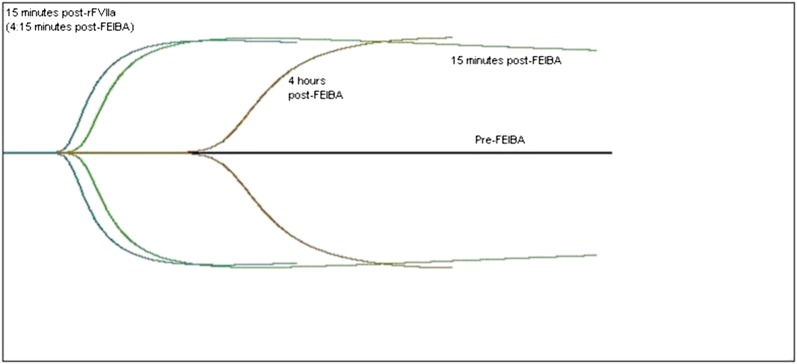
Figure 4.
Thromboelastograph curve before and after treatment. The black horizontal line is the patient’s baseline, which is flat and demonstrates no clot formation. The green curve represents 15 minutes after a dose of the bypassing agent, FEIBA 75 IU/kg. The brown curve represents 4 hours after the FEIBA has been infused, demonstrating a degrading of the blood’s clot-forming ability. The blue curve represents 15 minutes after a dose of rFVIIa, 90 μg/kg, demonstrating the additive effect of the 2 agents.

