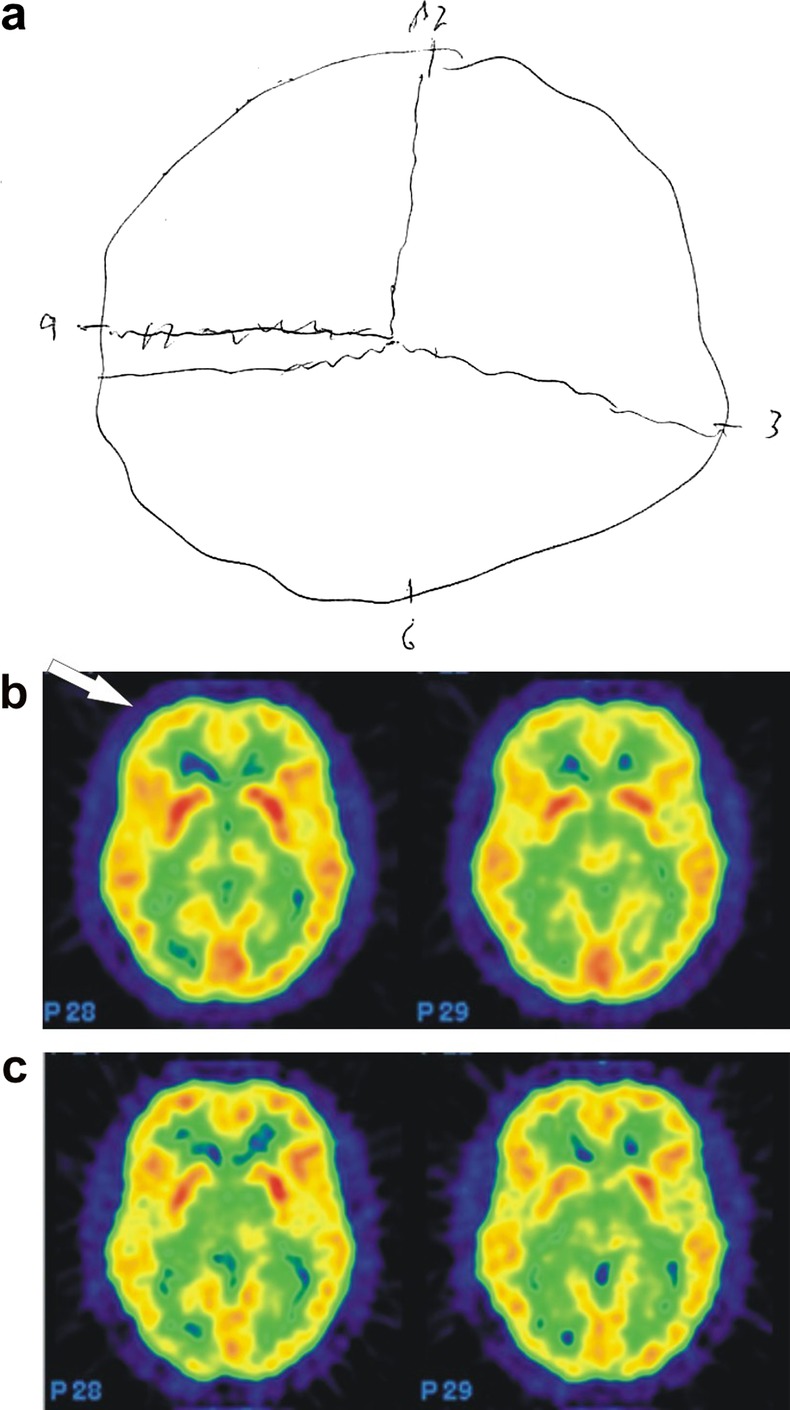
Figure 1.

Clock drawing test and positron emission tomography (PET) of the brain. (A) Patient's attempt to draw a clock showing ‘10 min past 11’. (B) PET before treatment showing frontal and fronto-basal hypometabolisms (arrow). (C) Normalised PET of the same region 4 months after treatment and clinical remission.
