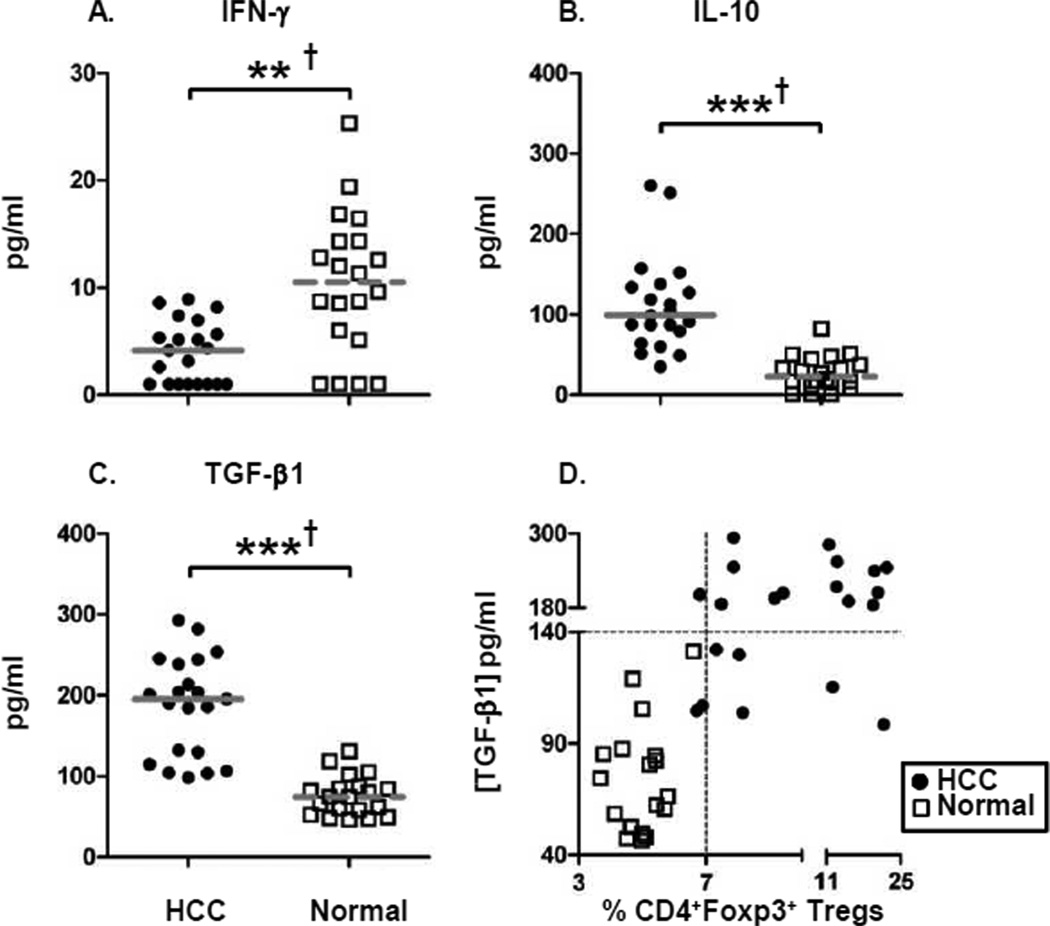
Figure 3. Elevated levels of immunosuppressive cytokines in HCC patients.
(A–C) Cytokine-specific sandwich ELISA of plasma from HCC patients
and healthy normal subjects were assayed in order to measure levels of circulating IFN-γ,
IL-10, and TGF-β1. (D) Correlation of TGF-β1 plasma levels and
frequency of CD4+Foxp3+ Tregs. Each symbol represents an individual HCC
patient ( )
or normal healthy subjects (
 ); lines represent median values for the group. ** P
< 0.01, *** P < 0.001, Mann-Whitney U test; †
P < 0.05 Hochberg adjustment for multiple comparison.

