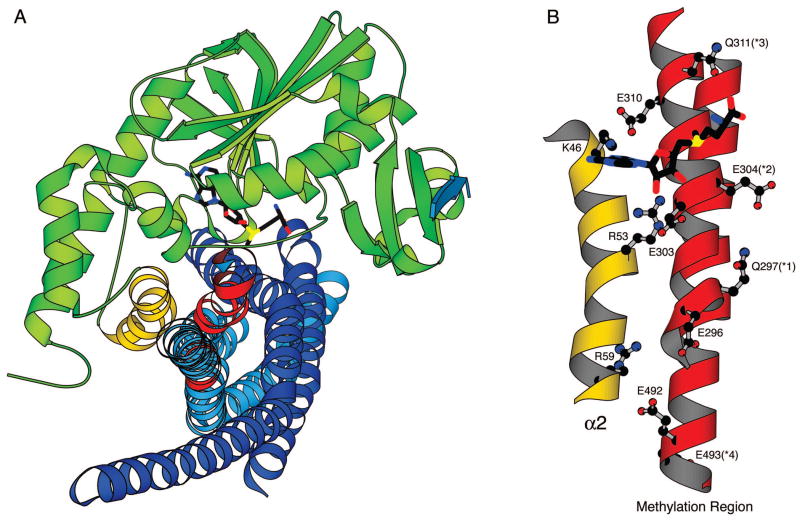
Figure 6.
Possible mode of interaction of methyltransferase CheR with the receptor methylation region derived from computational modeling. Modeling and filtering were performed as described in Experimental Procedures, yielding a single model complex with an overall orientation similar to that postulated from biochemical data. (A) Shape complementarity of CheR and the receptor substrate. CheR is shown in green with helix α2 highlighted in gold. A pentapeptide corresponding to the C-terminus of the receptor is shown in blue bound to the β-subdomain of CheR. The cofactor AdoMet, placed by superposition with the AdoHcy molecule present in the crystal structure, is shown in stick representation. The monomers of the receptor dimer region used in modeling are colored dark and light blue, with the methylation sites 1–4 highlighted in red. (B) Interactions of helix α2 of CheR with the receptor methylation region. An expanded view of helix α2 and the methylation regions of a receptor monomer, rotated ~90° from the view in (A) shows side chain interactions between the antiparallel helices of CheR and the receptor.

