Fig. 5.
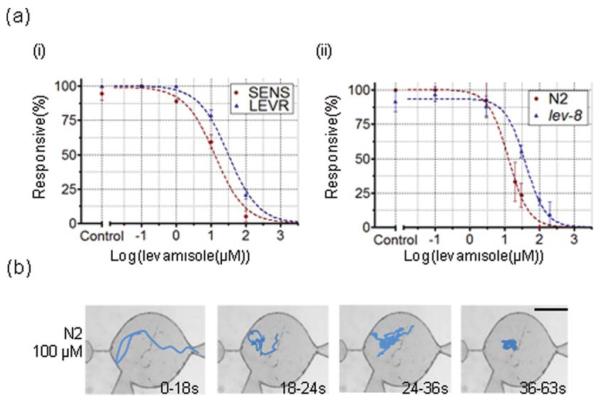
(a) Dose response generated by parameter (i), percentage of worms responsive, for O. dentatum (SENS and LEVR) (i) and C. elegans (L4 stage N2 and lev-8) (ii) nematodes in the microfluidic drug screening device. At low levamisole concentrations (0.1 μM for SENS, 10 μM for LEVR, 1 μM for N2 and 3 μM for lev-8), almost all worms are responsive. At higher concentrations, the percentage of worms unresponsive increases and eventually, at the cutoff concentration (~100 μM for SENS, ~150 μM for LEVR, ~100 μM for N2 and ~250 μM for lev-8), all worms are unresponsive. (b) [scale bar = 0.5mm] Representative tracks of L4 stage N2 C. elegans in the drug well of the microfluidic drug screening device. The tracks, shown as a function of time, give quantification as to how movement changes when the worm exposed to high (100 μm) dose of the drug. Initially, worm movement is spread over a large surface area; as time progresses, the amount of surface area reduces and eventually the worm becomes unresponsive.

