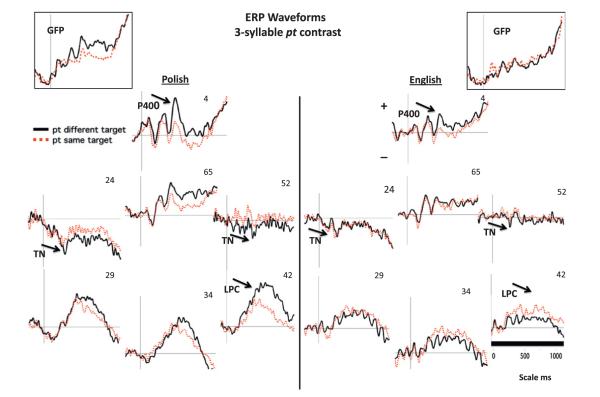
Fig. 5.
depicts the ERP voltage waveforms to the 3-syllable pt contrast. The TN, P400 and LPC are labeled. Note the larger LPC to the different target from the posterior parietal sites for the Polish participants, which was not found for the English participants positive = up, vertical line = target word onset, horizontal line at zero crossing. Boxed graphs in the upper corners depict GFP.

